

Seaton (Cornish: ‘Sethyn’, meaning ‘little arrow or twisting river’) is a south facing beach in South-East Cornwall, located at the mouth of the River Seaton, which meanders across the beach after flowing through the steep sided, wooded Hessenford valley. Aside from a car park and recreational spaces, the bottom of the valley remains undeveloped and forms part of the wider Seaton Valley Country Park and Nature Reserve.
The sand on Seaton Beach consists of coarse grey sand mixed with patches of shingle and the beach is fringed by outcrops of weathered rock. The upper shore of the beach is dominated by differing styles of seawall that, collectively, create a boundary between the natural and man-made environment. The village itself includes small number of shops lining the edge of the valley this then merges with the village of Downderry further to the east.

Coastal Change
The coastline of Cornwall is an ever-changing environment. Its energetic, dynamic, never still and changes with each wave and each tidal cycle. Some of the changes we see are gradual and barely noticeable, whilst others, such as rockfalls, happen suddenly and often shockingly.
From one visit to the next it can sometimes be difficult to see how a beach and dune system has changed, but information has been collected, and is being collected through the Making Space for Sand project, to help us better understand how the coastline is changing. The purpose of this section of the website is to understand each location has changed over time, how it could change in the future and understand the policies that influence how we can respond to these changes.
Shoreline Management Plans (SMP)
The Shoreline Management Plan (SMP) is a strategic planning and management assessment tool that helps identify and measure the risk associated coastal erosion and coastal flooding. The document makes a number of policy recommendations over short, medium and long term timeframes setting out a strategic approach to managing the built, natural and historic environments associated with the coastline. Within SMP there are four policy approaches which have been assigned to stretches of coastlines. The four policies are: No Active Intervention (NAI), Hold The Line (HTL), Managed Realignment (MR), and Advance The Line (ATL).
© Crown copyright and database rights 2026 Ordnance Survey AC0000817921.
Seaton sits within Policy Development Zone 1 (PDZ1), in Management Area 2 (MA2), within Policy Units (PU) 2.2 and 2.3. The policy recommendations for these policy units are detailed in the table below.
Use your touchscreen
to scroll the below table
| Policy Unit | Policy Plan | ||||
| 2025 | 2055 | 2105 | Comment | ||
| 2.1 | Downderry East
Main Policy Sub Policy |
NAI LAO |
NAI LAO |
NAI LAO |
Commitment from Cornwall Council to ongoing monitoring of the ‘Action Line’, to provide an ongoing re-assurance to the community. Most recent monitoring indicates maximum erosion of around 300mm over 5 years. Private defences have slowed down natural rates of erosion, though not all local defences have permission and local management activity will be kept under review. Allow continuation of the natural slower erosion at Downderry east of Beach Hill, supported by ongoing monitoring. |
| 2.2 | Downderry West & Seaton
Main Policy Sub Policy |
HTL RNR
|
MR SE |
MR SE |
Initially hold defences during epoch 1, continuing SMP1 policy. Longer term objective is to allow coast to adjust in medium to longer term through managed realignment, which would require development planning support to manage the relocation of existing property away from high-risk zones. The implications of this approach for highway links along this section will also be considered. Private defences in this section have slowed down natural rates of erosion, though not all local defences have permission and local management activity will be kept under review. |
| 2.3 | Seaton Beach
Main Policy Sub Policy
|
MR NF |
NAI CtM |
NAI CtM |
Return to a naturally functioning frontage by gaining commitment to early realignment of the road to achieve robust resilience to future flooding, whilst maintaining community connectivity. Any realignment should not reduce the capacity of the river to discharge. |
| Key Main Policy: HTL - Hold the Line, A - Advance the Line, NAI – No Active Intervention MR – Managed Realignment,
Sub Policy: LAO - Local Activity Only, RNR - Repair Not Replace, SE - Slow Erosion, NF - Natural Features, CtM - Cease to Maintain |
|||||
The SMP can be accessed through the Cornwall Council website using this link: Cornwall and Isles of Scilly Shoreline Management Plan 2


© Crown copyright and database rights 2026 Ordnance Survey AC0000817921.
NCERM (National Coastal Erosion Risk Mapping)
This mapping provides a baseline of coastal erosion for the coastline of England. The national coastal erosion risk map (NCERM) shows the areas at risk of coastal erosion until 2105. Predicting the exact position of an eroding shoreline over time is difficult. The influence of sea level rise on erosion rates in the longer term is also uncertain. The rate of erosion can vary depending on the geology and the natural processes at the coast. Hard rocks are worn away slower than softer material such as sand. This means erosion may not be the same along a stretch of coast.
Erosion risk zones displayed on the map include the area between the backshore feature (such as a cliff) and the Mean High Water Spring (MHWS) tidal position. These are shown for three climate change scenarios:
- Present Day (2020) –uses historical erosion rates to provide future projections without calculating any additional impacts of climate change and rising sea levels. Beige layer
- Climate Change Higher Central –uses sea level rise data from 70th percentile (UK Climate Projections 2018 (UKCP18) Representative Concentration Pathway (RCP)8.5 climate projection. Light purple layer
- Climate Change Upper End –uses sea level rise data from 95th percentile UKCP18 Representative Concentration Pathway (RCP) 8.5 climate projection. Dark purple layer
What does this mean? Using the Climate Change Upper end as an example, it means that 95% of the possible scenarios fall below this level, while 5% fall above it. The RCP 8.5 value is a scenario used in climate modelling that considers the continued growth and production of greenhouse gas emissions. When planning for coastal change these worst-case scenarios, through more precautionary, help ensure that coastal management is, in the longer term, more resilient.
Unless otherwise stated, the erosion risk zones are based on the scenario that the Shoreline Management Plan (SMP) policy for the area has been delivered. A change in the policy, or the ability to deliver the policy intent, may affect the erosion projections.
The map provides the best estimate of coastal erosion risk at a national scale. It uses the best available national and local data along with methods which can be applied at a national scale. The erosion projections associated with NCERM are intended for guidance and cannot provide details for individual properties. The NCERM data considers the predominant risk at the coast and frontages considered to be more at risk from flood risk or areas of complex cliff are not always included.
Gaps in the erosion Line
The reason there is a gap shown in the erosion line at this location is that in the areas where flooding is the main source of risk to people and property behind the shoreline, no erosion projections are shown. However, there can sometimes be minor risks from erosion or a connection between flood and erosion processes. The map shows a clear boundary between flood and erosion risk areas, but the actual transition between flood and erosion risk zones is usually less distinct in reality.
Click on the link below to access the Cornwall Council NCERM Mapping site, read the about section then click on layers - Shoreline Management Plan - NCERM SMP 2105.
3D Modelling of Sea Level Rise
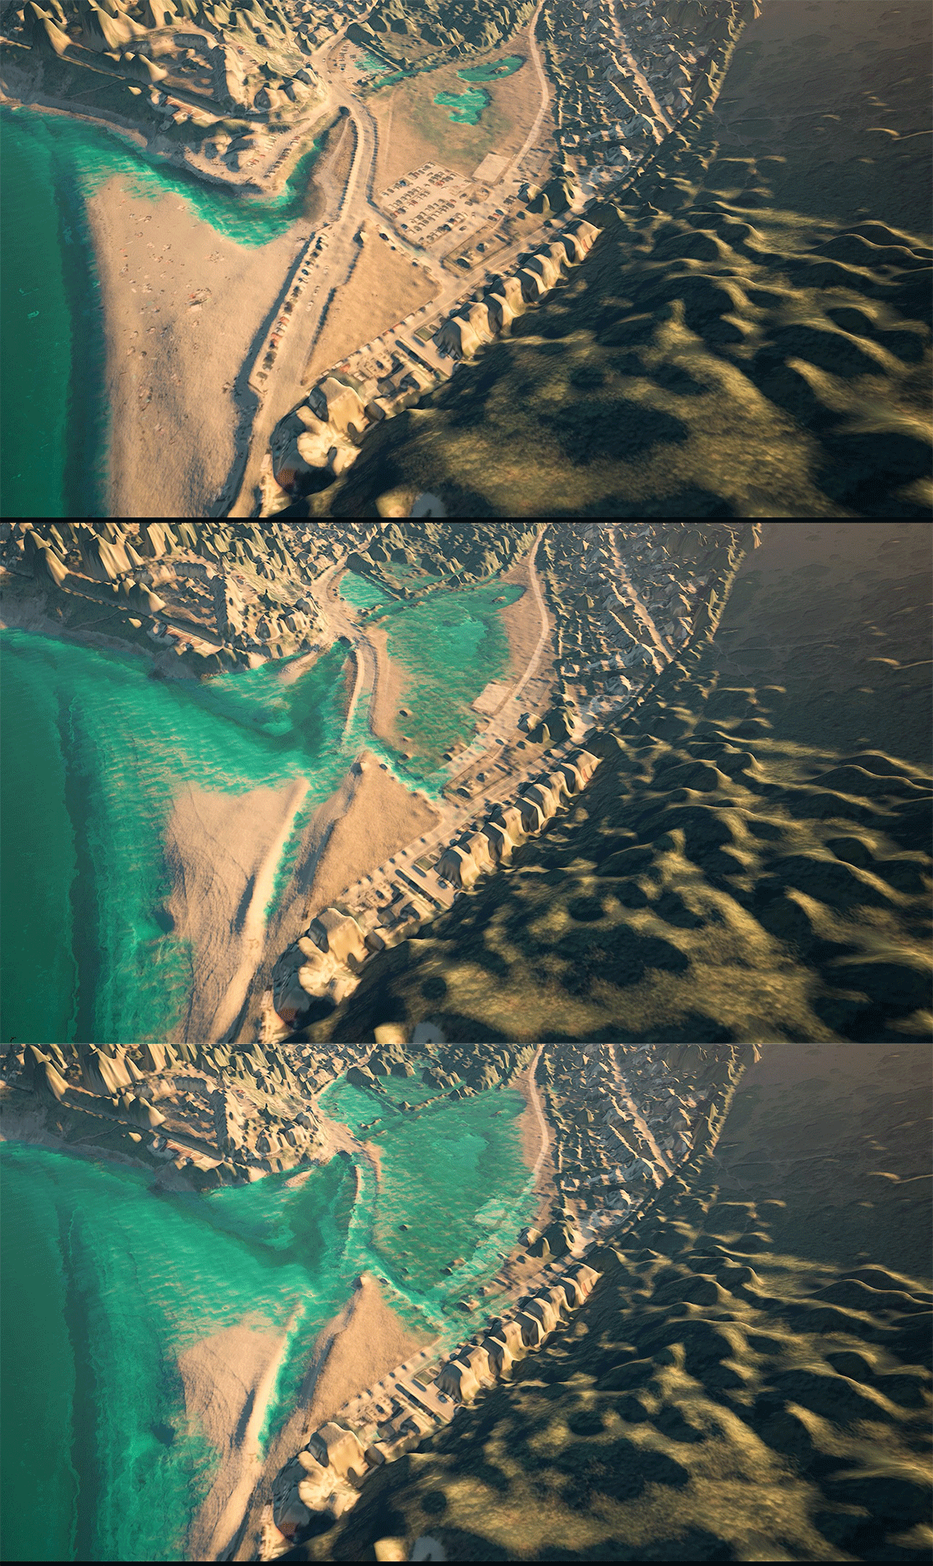
The National Coastal Erosion Risk Map (NCERM) helps to provide a risk projection of how the coast may change over time. However, it doesn’t consider areas with high flood risk or predict the sea’s future position. To address this, the MS4S project has created 3D visuals that combine sea level rise and coastal change for flood-prone areas. They match Shoreline Management Plan (SMP) timeframes in three stages: present day, 2055, and 2105.
The visuals use the Climate Change Higher Central scenario, shown in the NCERM section above, and assumes SMP policies haven’t been implemented, leaving erosion unchecked. Where the policy is ‘Hold the Line’ and defences have not been maintained or replaced, they show faster change after defences fail, a process known as coastal catch-up. Where there are gaps in the NCERM data, the Bruun modelling below, modelled by the University of Plymouth, provides guidance.
The animation shows the approximate Mean High Water levels and does not show higher or (Spring tides) or low (Neap tides) referencing tidal gauge data from Plymouth, Newlyn, and Padstow. Sea level projections use the Climate Change Higher Central scenario for Mean High Water levels in three, slightly different to the SMP above, epoch stages: 2025, 2075, and 2125. They give an easy-to-understand view of how the coast might look in the future. However, they are for guidance only and recognise that there are uncertainties associated with erosion and sea level rise.
Historical Images
Historical photographs provide a powerful insight into how the Cornish coastline has changed within the past Century. The Making Space for Sand project are working in collaboration with the Francis Frith collection and have been given permission to share historical images on a number of beaches considered within the project.
In looking back, we can better understand how the coastline has changed, helping us understand not only how the coastal fringe has developed but also the potential future changes that we my observe. When this is considered alongside forecasts of coastal erosion and sea level rise it will help enable us to better adapt to our changing coastline.
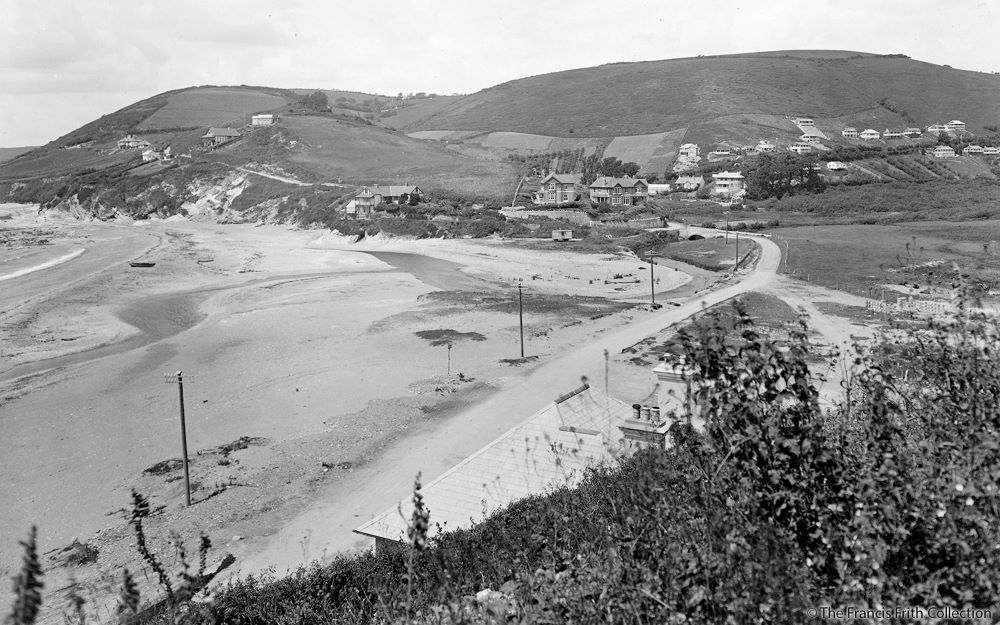
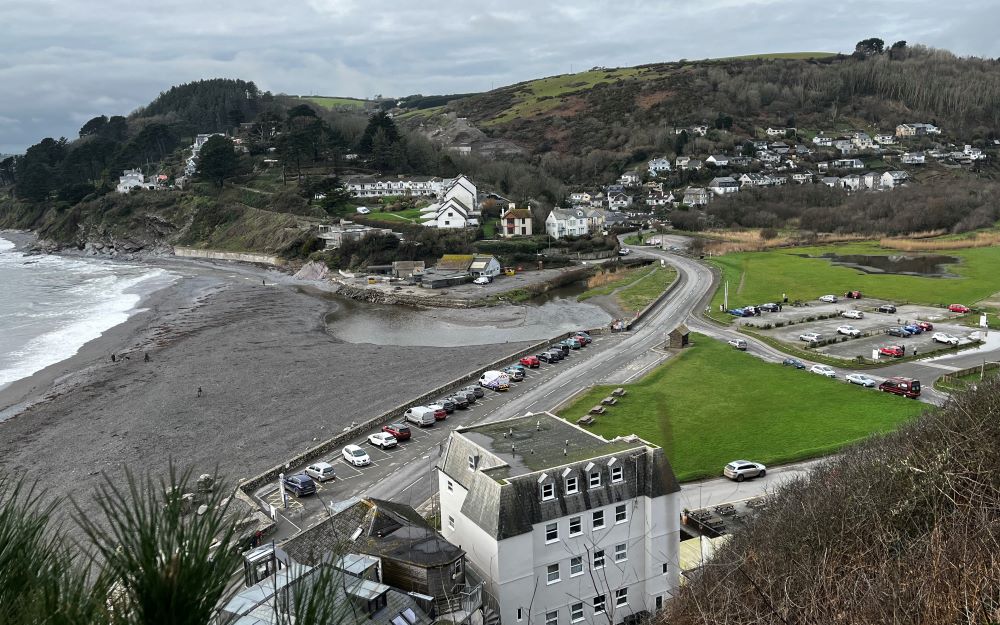
Seaton beach from eastern cliffs in 1930 (Image courtesy of the Francis Frith collection) and in 2024.
Click and hold in the middle of the slider and slide left and right


Bridge Road at Seaton c1950 (Image courtesy of the Francis Frith collection) and in 2024.

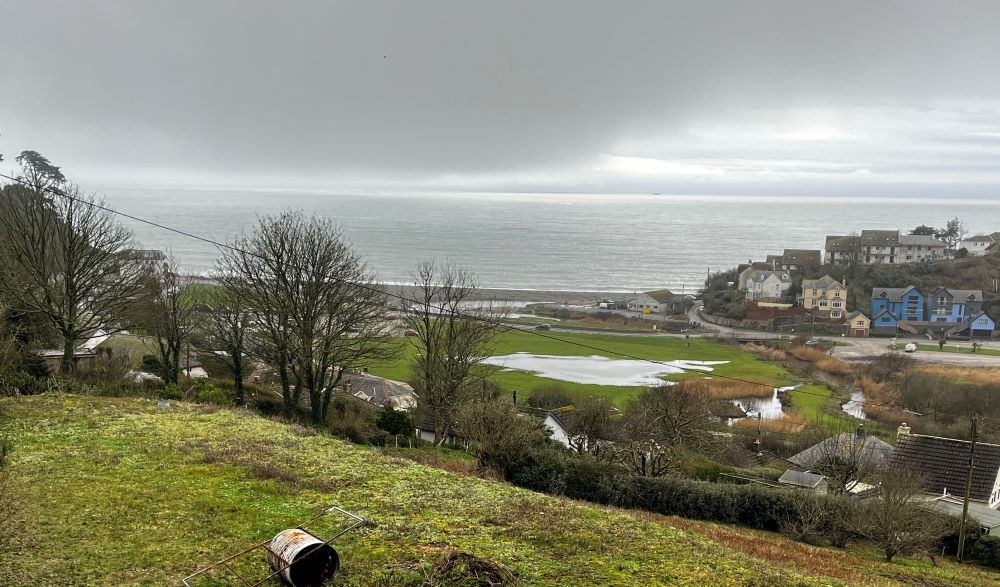
View of seaton valley from Tregunnick Lane c1965 (Image courtesy of the Francis Frith collection) and in 2024.

Modelling Coastal Change
The gathering of data will enhance our understanding of beach-dune dynamics and how these are affected by the increasing strength of storm events and sea level rise. It will consider the movement of the sand by wind and tide and how this affects the growth of dune systems. Computer modelling will then be used to predict how the shoreline and the beach-dune systems may change over the next 50 to 100 years.
The ultimate aim is to compare the topographic changes to the beach-dune systems to other datasets (e.g. wave heights, wind and rainfall) to make connections between cause and effect.
Beach Report
The South West Coastal Monitoring (SWCM) programme have routinely been collecting data about the Cornish coastline since 2006. The aim of the data is to better understand changes observed on the coastline to help enable coastal managers to plan for future coastal change.
Using several years of information, SWCM have created a beach report for each MS4S site, including one for Seaton. The purpose of this report is to help the reader better understand the range of the surveys completed on Seaton and see the changes recorded. Some of the changes observed are gradual, whilst others, such as those associated with serve storm conditions, are more sudden and dramatic.
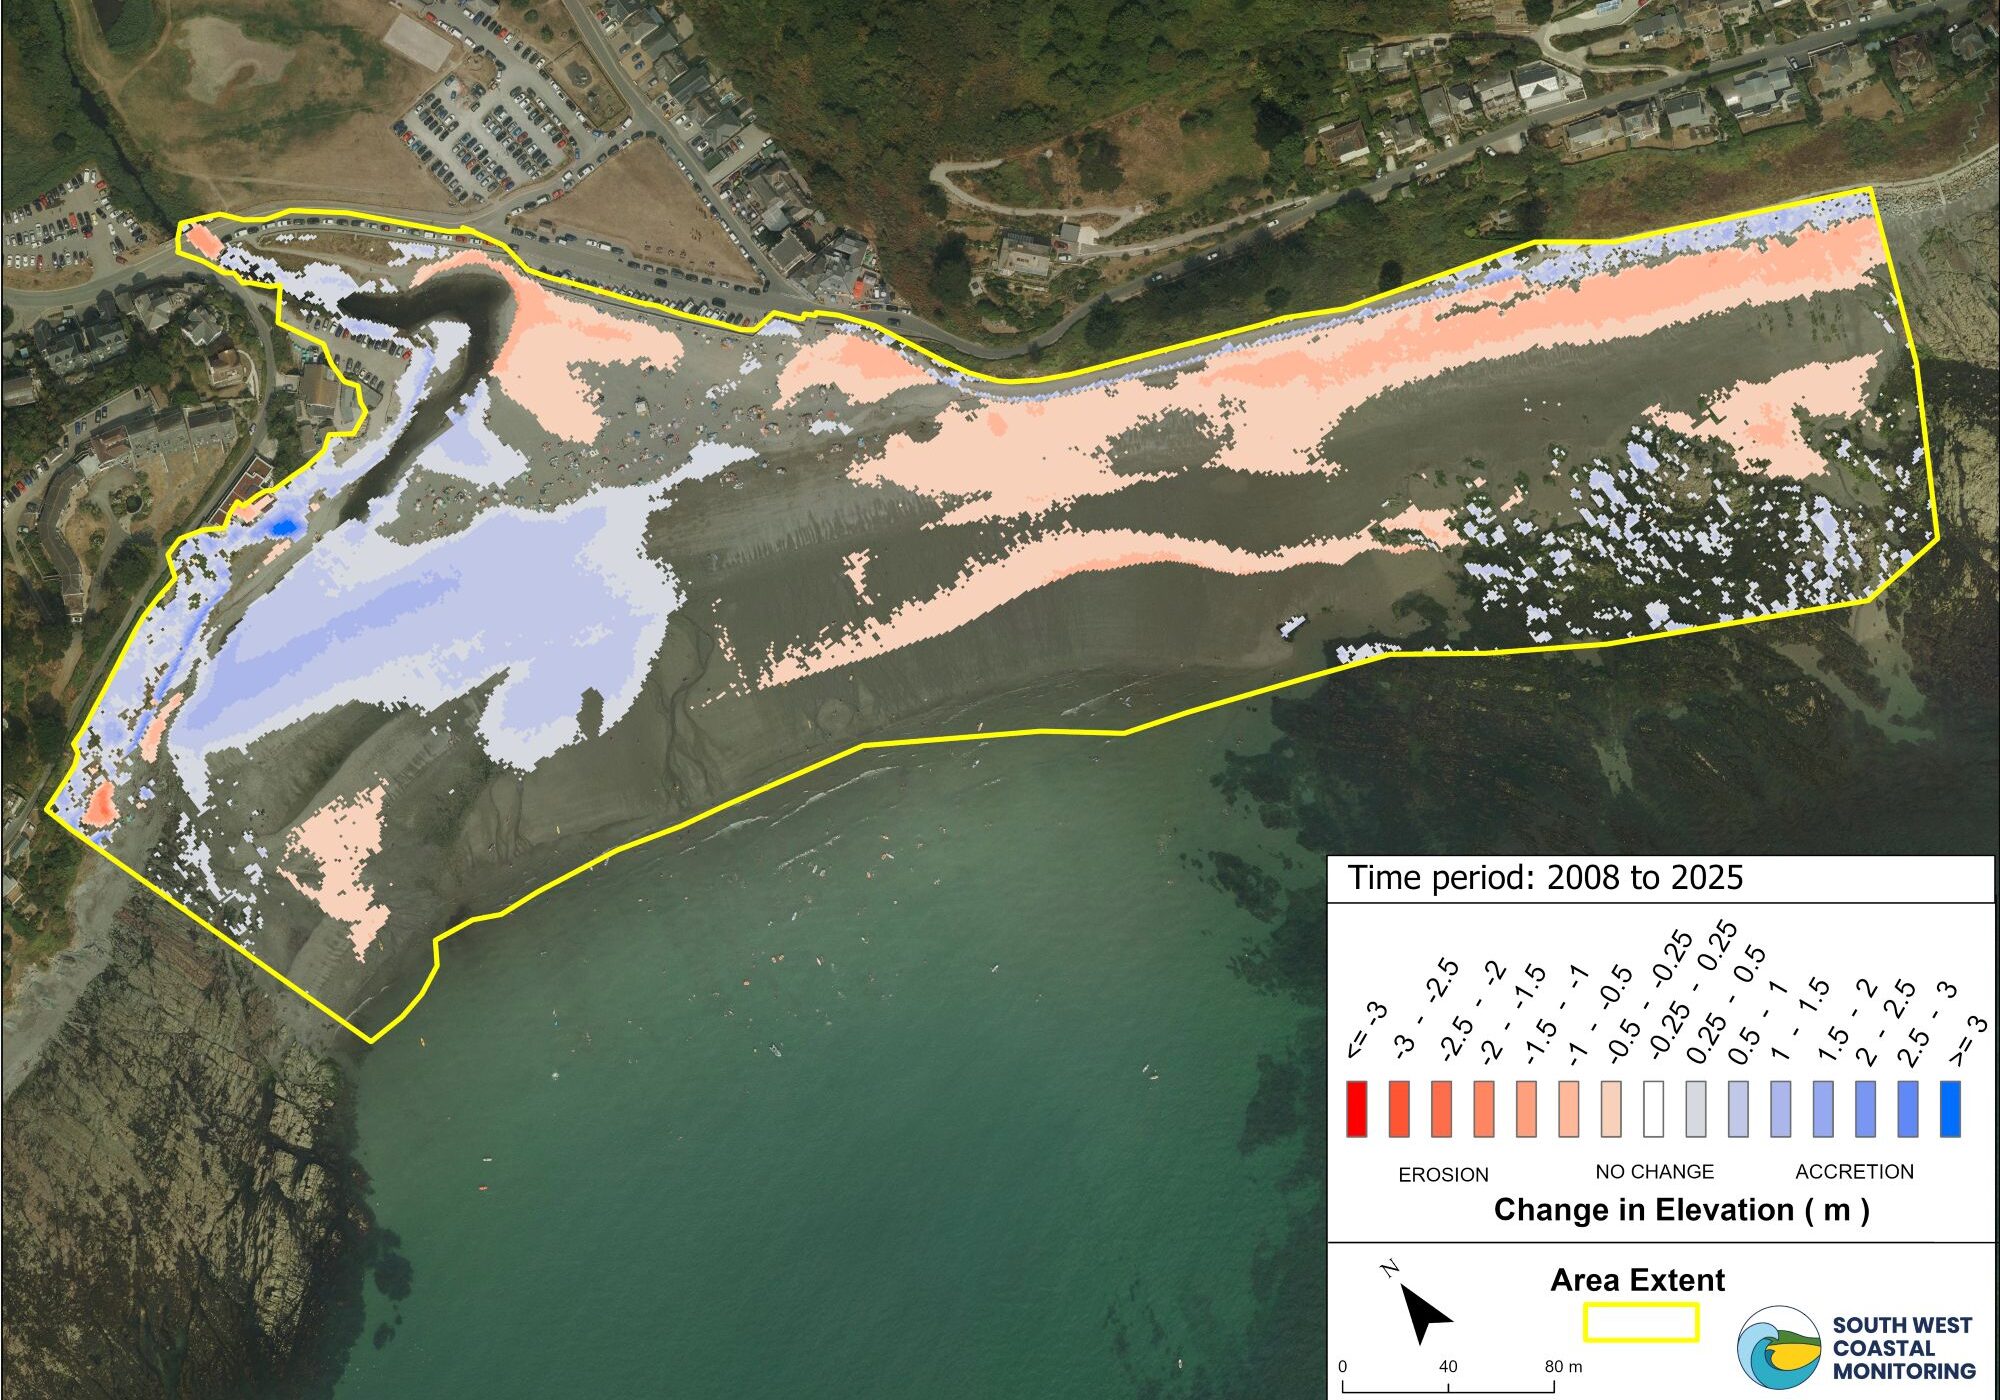
The picture above represents a combination of LiDAR data captured from c2008 - 2025 and the shading illustrates how sand (sediment) has been gained and lost over this period of time. The areas shaded blue are areas where sand has built up (increase in sediment) and areas shaded red show where sand has been lost (erosion of sediment). The deeper the shade of red or blue, the greater the level or erosion or accumulation.
SWCM provide an interactive map viewer on their website that allows users to explore and view the various data types they collect. If you want to learn more about this location, or other beaches in the south west, please visit their Map Viewer webpage.
Bruun Rule
Future change in the dune toe position, at this location, has been projected using either Bruun rule or estimated based on observed trends. The Bruun rule is a mathematical model to help us predict how our beaches will change with sea level rise. It is based on the theory that beaches will shift upwards and landwards in order to ‘keep up’ with sea level rise. The Bruun rule doesn’t consider all variables so there is a degree of uncertainty with these projections, however, they represent a first-stage assessment of future dune behaviour in Cornwall.

On Seaton beach sediment is currently eroding from the uppershore and/or dune toe and there is a decrease in the volume of sediment further inland. With sea level rise the estimated rate of retreat at the location is 26m (0.34m per year) by 2100. For more information on Bruun Rule modelling go to the Data Modelling webpage.
The visual presented above displays a number of things. The areas shaded blue are areas where surveys identify an increase in elevation (accumulation of sediment) and areas shaded red a decrease in elevation (erosion of sediment). The deeper the shade of red or blue, the greater the level or erosion or accumulation. The solid black line marks the edge of the dune toe and/or the top of the beach. The solid green line marks the projected rate of erosion by 2100, by using the Bruun Rule. This assumes the highest baseline climate change scenario where emissions continue to rise throughout the twenty-first century, Representative Concentration Pathway (RCP 8.5). The faint green line either side of the solid green line visualises the 90% confidence interval for the projection, indicating how the situation could be better or worse than projected.
Tromino
Tromino surveys help scientists find out how much sand is stored beneath a beach without digging. A small device called a Tromino measures tiny natural vibrations in the ground caused by waves, wind, and traffic. Different materials such as sand, gravel, clay, and rock vibrate in different ways, allowing scientists to estimate what lies below the surface and how deep it is.
The results are used to create underground maps of beaches, showing where sand layers end and rock layers begin. This helps scientists understand how beaches may change in the future as sea levels rise and storms become more frequent. The information is also used in computer models to support coastal management and help protect coastlines.
Please find below the report for this location:
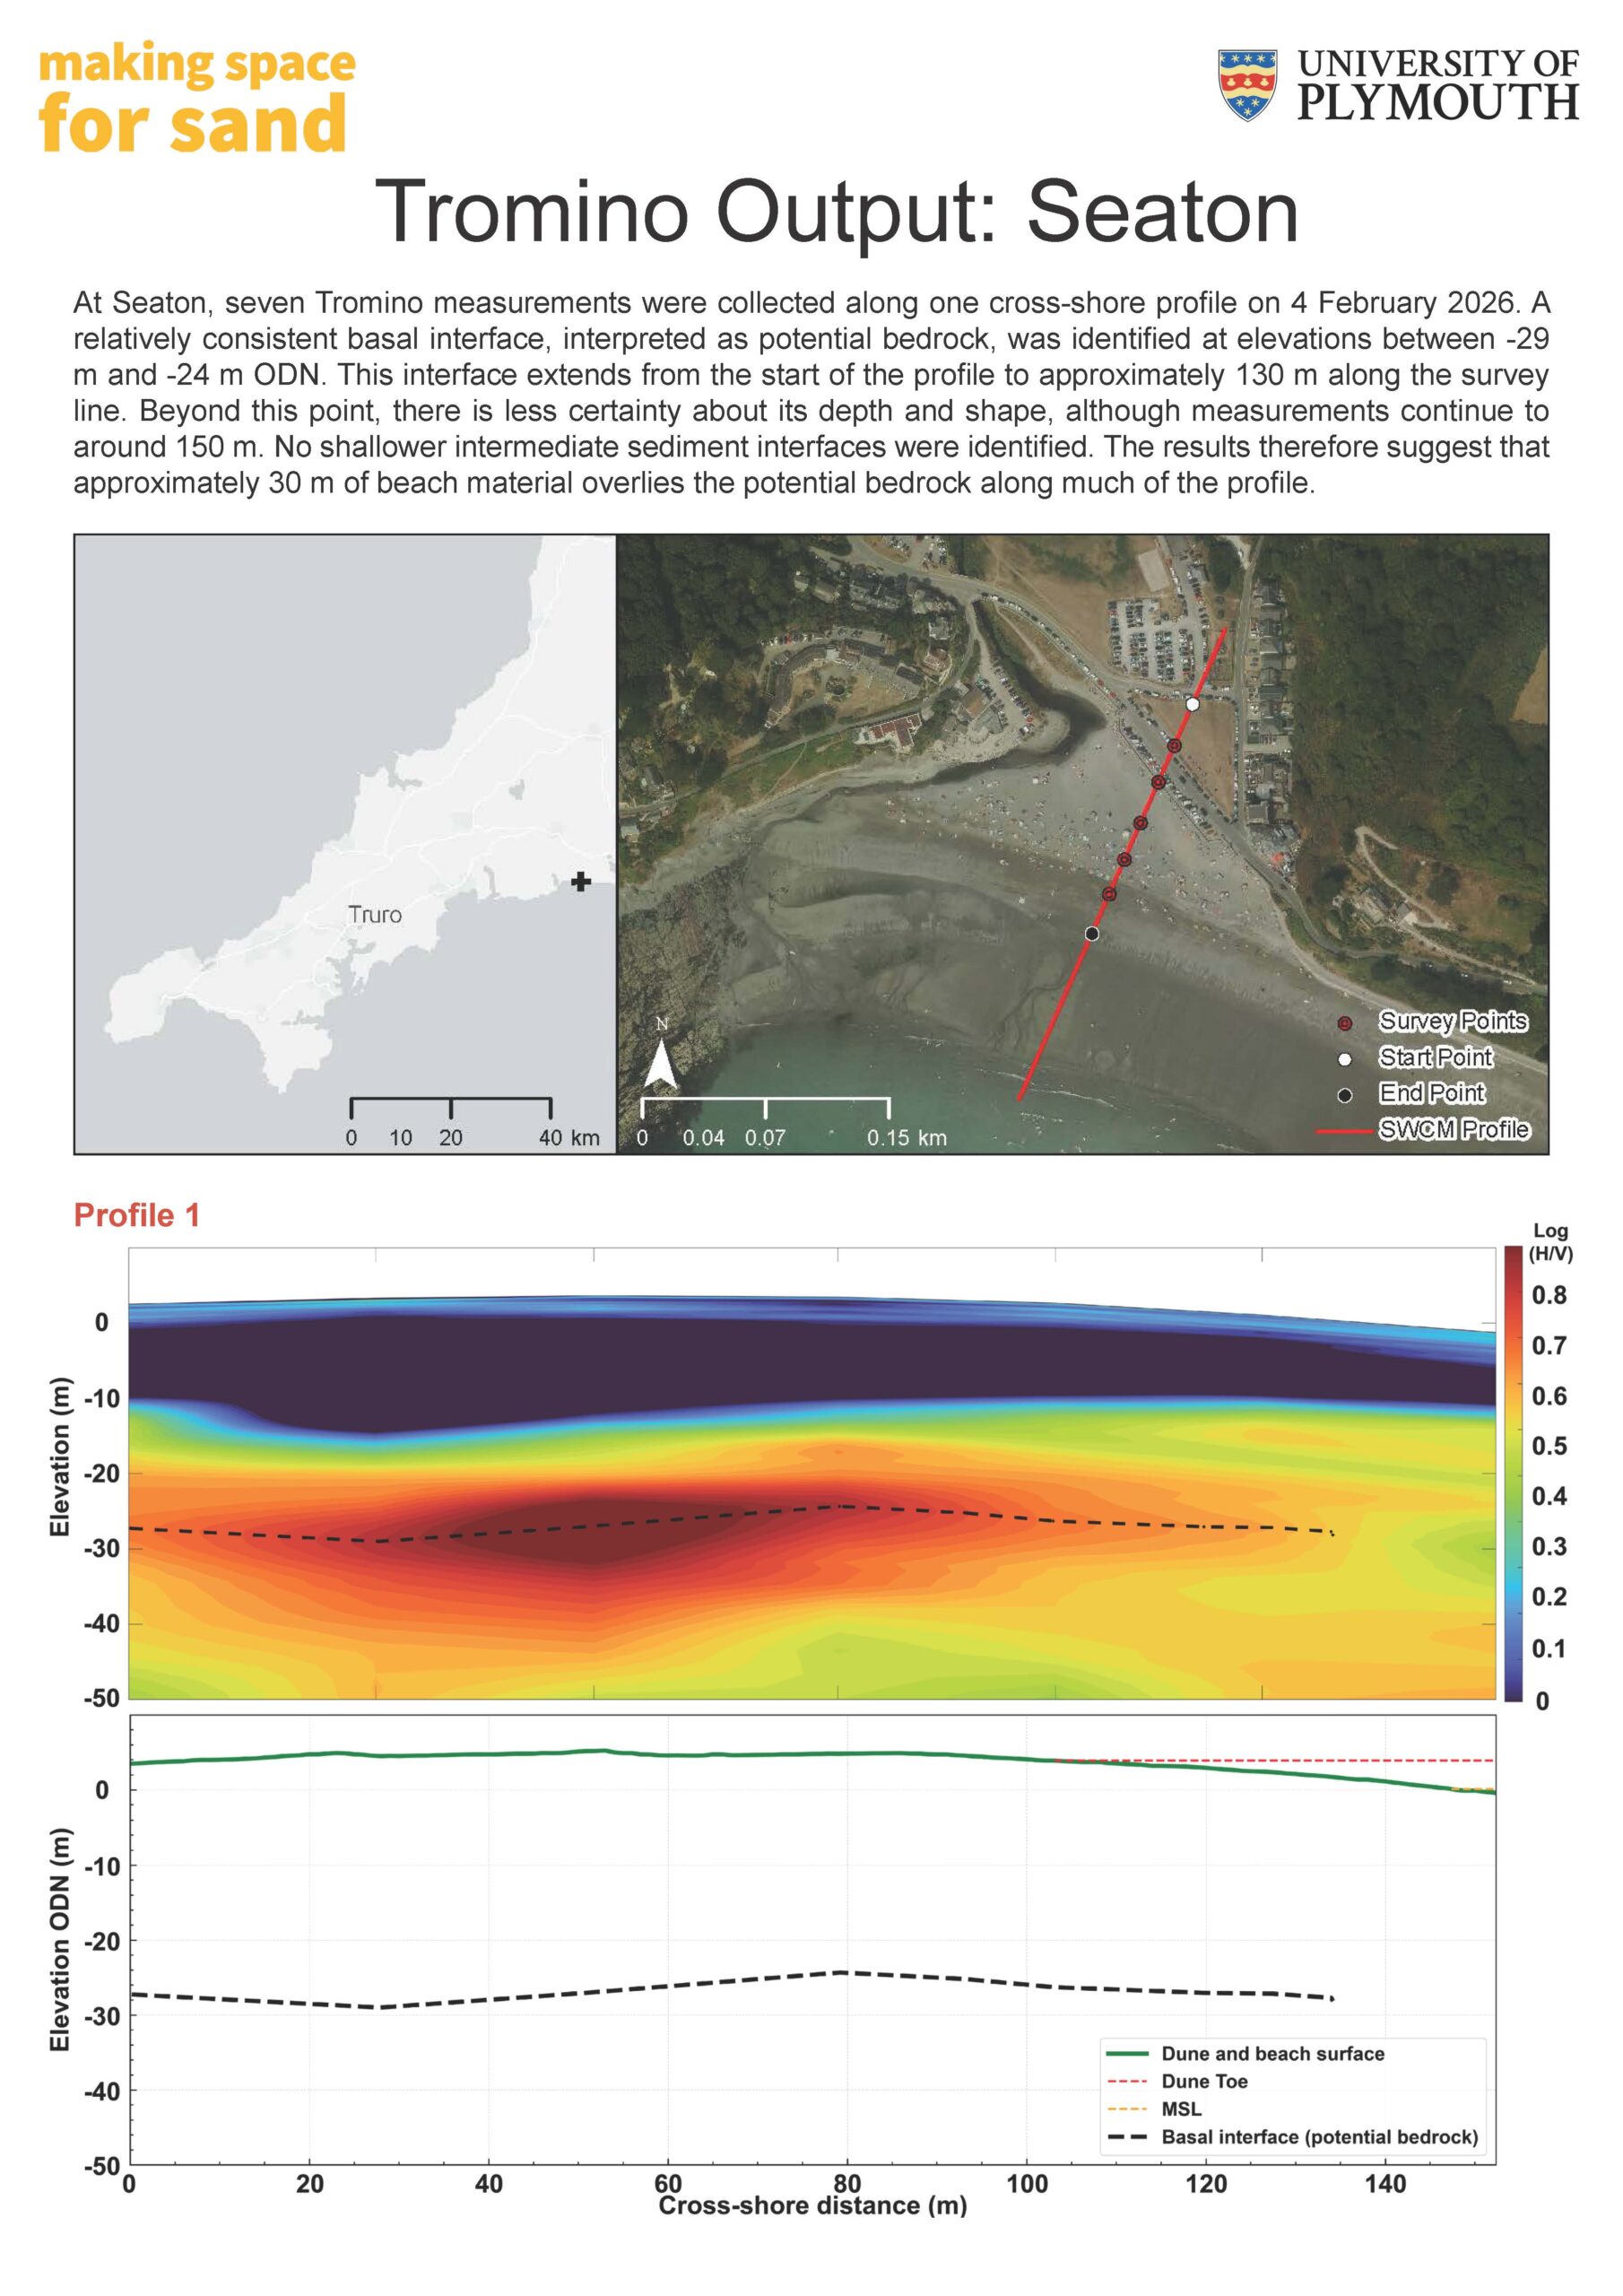
To interpret Tromino data, read the graph from left to right, moving from the dunes towards the lower beach. The green line shows the beach surface, while dashed lines represent boundaries between different underground materials, such as sand, gravel, or bedrock. The dashed yellow line represents the Mean Sea Level (MSL) which is the average height of the sea surface used to measure elevation.
Areas coloured red and yellow indicate stronger changes between layers and help identify where these boundaries are located. Blue and green colours show weaker changes. The deeper dashed black line usually represents the base of the sediment or possible bedrock, while dashed blue lines show shallower sediment layers. By looking at the depth and position of these layers, scientists can estimate sediment thickness across the beach.
South West Coastal Monitoring Dashboard
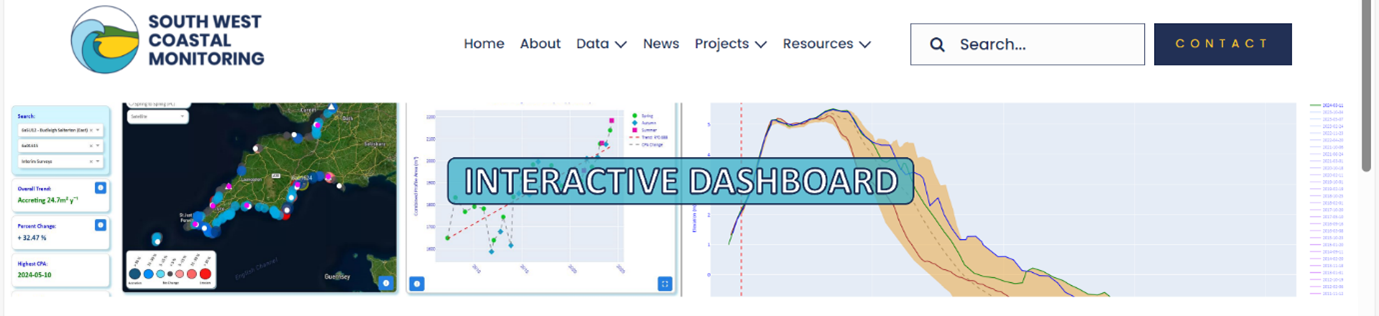
The South West Coastal Monitoring Dashboard is a new, interactive and intuitive tool which you can use to analyse the latest and historic topographic data for all beaches in the South West.
The Dashboard's main purpose is analyse how beaches across the South West have changed historically over the last 18 years. It provides an overview of change of the South West but also allows you to investigate in detail, certain beach profiles for a specific survey date at a site of interest. The Dashboard displays the following six interactive features:
- Map Overview - Provides a regional overview of historic and yearly change for each survey unit.
- Combined Profile Area Chart (CPA m²) - Represents the combined profile area trend in cross-sectional area (CSA m²) for each survey unit.
- Profile Cross-Sectional Area Chart - Provides a visual representation of the beach profile cross-sectional area (CSA m²) change.
- Box Plot - Displays the latest cross-sectional area (CSA m²) min, max, upper and lower quartile ranges for all profiles in the survey unit.
- Cross-Sectional Area Change Table - Displays cross-sectional area (CSA m²) and percentage change values for each beach profile.
- Survey Report Generator - Automatically generates a topographic survey report for a survey unit of choice.
To access the South West Coastal Monitoring Dashboard please click on the button below:

Designations
The coastline represents an important transition between the marine environment and the terrestrial environment. This transition creates a range of special habitats and exposes a range of interesting features, which can result in these spaces being highly designated and protected. There are a range of designations that recognise a variety of different features. At this location these designations are explored below.
Marine Conservation Zone (MCZ)
A Marine Conservation Zone (MCZ) is a type of marine protected area, designated in English, Welsh and Northern Ireland territorial offshore waters, to protect a range of nationally important, rare or threatened marine habitats or species by halting or reversing damage and degradation caused by human activities.
The Whitsand and Looe Bay MCZ covers an area of 52km², extending along the mean high water mark from Portnadler Bay to Rame Head. The sediment supports populations of bivalve molluscs and marine worms and provides a habitat for commercially important fish and shellfish, while the site’s intertidal rocky habitats are characterised by animals such as sponges, sea squirts and the rare giant goby. Further out to sea there are shipwrecks and small areas of subtidal rocky reef that support pink sea-fans and rare sea-fan anemones.
Image of an edible crab (Courtesy of Tony Sutton)
Sign up to Making Space for Sand
If you would like to get involved in helping to make dunes more resilient and biodiverse, want to help develop coastal adaptation and emergency plans or just want to know more about what the project is learning about coastal change, please click here: