

Summerleaze is a west facing beach in north Cornwall associated with the town of Bude.
Summerleaze appears to be a deeply incised, relatively narrow beach composed of fine sand, rich in shell fragments, which is why it was historically considered valuable for agricultural purposes. However, as the tide drops beyond Cross Rock and the seapool, the beach opens up into a wider bay that considers Crooklets Beach to the north. As a result of the orientation of the cliffs, during larger tides, it’s possible to walk north of Crooklets almost 7km up the coast to Sandymouth.
Bude (Cornish: Porthbud, meaning ‘cove of the river Bud’) in itself, is a relatively new town. Its early importance was associated with shipping and fishing. More latterly the canal was built to help transport sediment from the beach for nutrient poor inland soils. The Bude branchline, built in the late 19th Century help the town develop as a seaside resort. The town, with its associated beaches, has been a popular seaside destination ever since.
The industrial scale of sand removal on Summerleaze has influenced how the coastline has evolved at the site. Once sediment removal ceased, sand built up, forming the dunes we see today. The dunes however are partially constrained by the carpark, which will become increasing more vulnerable as the dune rolls back.

Coastal Change
The coastline of Cornwall is an ever-changing environment. It is energetic, dynamic, never still and changes with each wave and each tidal cycle. Some of the changes we see are gradual and barely noticeable, whilst others, such as rockfalls, happen suddenly and often shockingly.
From one visit to the next it can sometimes be difficult to see how a beach and dune system has changed, but information has been collected, and is being collected through the Making Space for Sand project, to help us better understand how the coastline is changing. The purpose of this section of the website is to understand each location has changed over time, how it could change in the future and understand the policies that influence how we can respond to these changes.
Shoreline Management Plans (SMP)
The Shoreline Management Plan (SMP) is a strategic planning and management assessment tool that helps identify and measure the risk associated coastal erosion and coastal flooding. The document makes a number of policy recommendations over short, medium and long term timeframes setting out a strategic approach to managing the built, natural and historic environments associated with the coastline. Within SMP there are four policy approaches which have been assigned to stretches of coastlines. The four policies are: No Active Intervention (NAI), Hold The Line (HTL), Managed Realignment (MR), and Advance The Line (ATL).
© Crown copyright and database rights 2026 Ordnance Survey AC0000817921.
Summerleaze sits within Policy Development Zone 16 (PDZ16), in Management Area 40 (MA40), within Policy Units (PU) 40.2 and 40.3. The policy recommendations for these policy units are detailed in the table below and the SMP can be accessed through the Cornwall Council website using the link below.
Use your touchscreen
to scroll the below table
| Policy Unit | SMP2 Policy Plan | ||||
| 2025 | 2055 | 2105 | Comment | ||
| 40.2 | Bude Haven & Canal area
Main Policy Sub Policy
|
HTL M/R |
HTM M/R |
HTL M/R |
Maintain the structures providing coast protection and/or flood defence function (breakwater, revetments, sea walls, canal walls and locks). Policy intent is to maintain structures in the unit as not doing so would create significant flood risk to many assets and a number of listed buildings withing the area. Breakwater provides significant coastal protected for unit 40.3 (Summerleaze Beach).
|
| 40.3 | Summerleaze beach
Main Policy Sub Policy
|
MR P |
MR P |
NAI LAO |
Objective is to reduce risks by establishing more robust natural defence and naturally responding buffer zone by improvement of dunes and moving tourist-based infrastructure and commercial development away from the erosion and flood risk zones. The long-term policy intent is to allow natural evolution and process to occur. Community adaptation strategy required. |
| Key Main Policy: HTL - Hold the Line, A - Advance the Line, NAI – No Active Intervention, MR – Managed Realignment
Sub Policy: M/R – Maintain/Replace, P – Placeholder, LAO Local Activity Only |
|||||


© Crown copyright and database rights 2026 Ordnance Survey AC0000817921.
National Coastal Erosion Risk mapping (NCERM)
This mapping provides a baseline of coastal erosion for the coastline of England. The national coastal erosion risk map (NCERM) shows the areas at risk of coastal erosion until 2105. Predicting the exact position of an eroding shoreline over time is difficult. The influence of sea level rise on erosion rates in the longer term is also uncertain. The rate of erosion can vary depending on the geology and the natural processes at the coast. Hard rocks are worn away slower than softer material such as sand. This means erosion may not be the same along a stretch of coast.
Erosion risk zones displayed on the map include the area between the backshore feature (such as a cliff) and the Mean High Water Spring (MHWS) tidal position. These are shown for three climate change scenarios:
- Present Day (2020) –uses historical erosion rates to provide future projections without calculating any additional impacts of climate change and rising sea levels. Beige layer
- Climate Change Higher Central –uses sea level rise data from 70th percentile (UK Climate Projections 2018 (UKCP18) Representative Concentration Pathway (RCP)8.5 climate projection. Light purple layer
- Climate Change Upper End –uses sea level rise data from 95th percentile UKCP18 Representative Concentration Pathway (RCP) 8.5 climate projection. Dark purple layer
What does this mean? Using the Climate Change Upper end as an example, it means that 95% of the possible scenarios fall below this level, while 5% fall above it. The RCP 8.5 value is a scenario used in climate modelling that considers the continued growth and production of greenhouse gas emissions. When planning for coastal change these worst-case scenarios, through more precautionary, help ensure that coastal management is, in the longer term, more resilient.
Unless otherwise stated, the erosion risk zones are based on the scenario that the Shoreline Management Plan (SMP) policy for the area has been delivered. A change in the policy, or the ability to deliver the policy intent, may affect the erosion projections.
The map provides the best estimate of coastal erosion risk at a national scale. It uses the best available national and local data along with methods which can be applied at a national scale. The erosion projections associated with NCERM are intended for guidance and cannot provide details for individual properties. The NCERM data considers the predominant risk at the coast and frontages considered to be more at risk from flood risk or areas of complex cliff are not always included.
Click on the link below to access the Cornwall Council NCERM Mapping site, read the about section then click on layers - Shoreline Management Plan - NCERM SMP 2105.

Historical Images of Summerleaze
Historical photographs provide a powerful insight into how the Cornish coastline has changed within the past Century. The Making Space for Sand project are working in collaboration with the Francis Frith collection and have been given permission to share historical images on a number of beaches considered within the project.
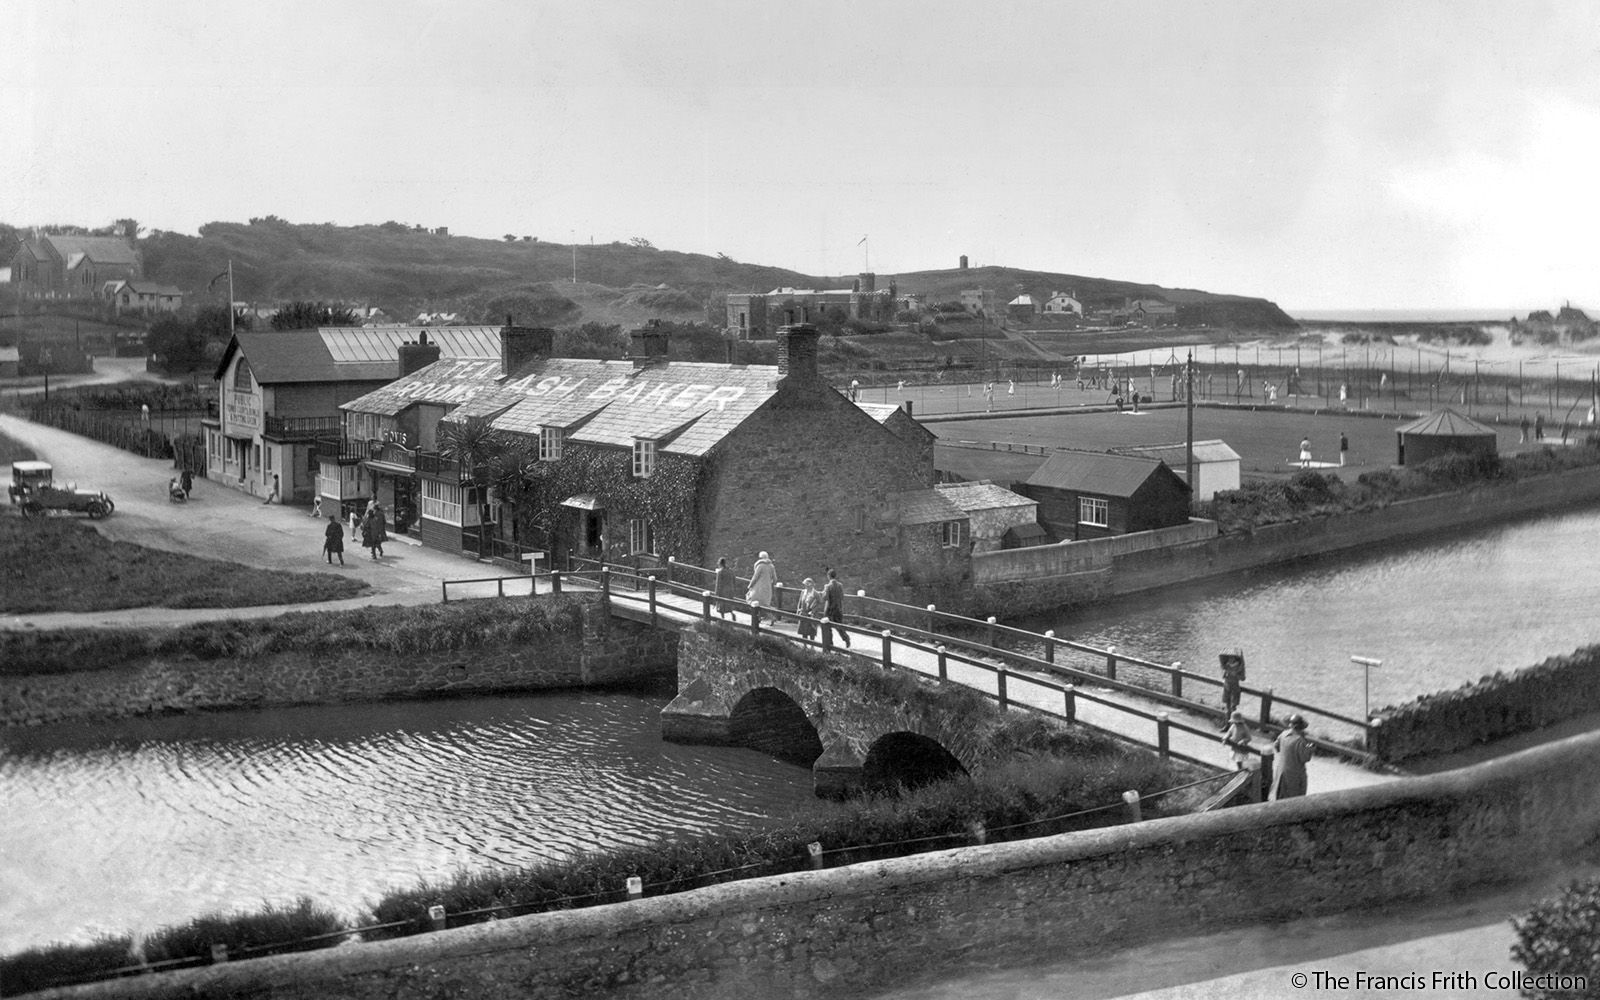

Image of Nanny Moore's bridge in1931 (Courtesy of the Francis Frith collection) and in 2023.
Click and hold in the middle of the slider and slide left and right
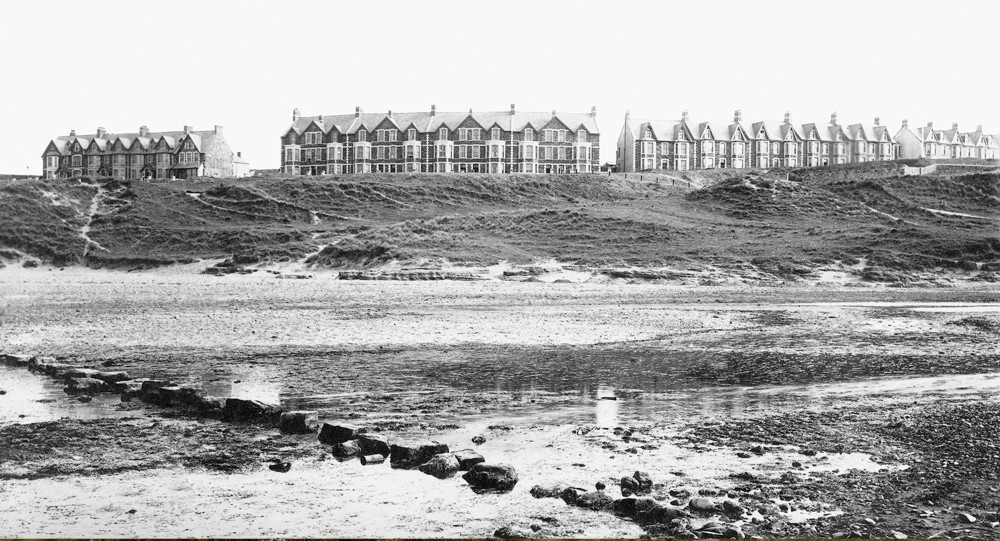
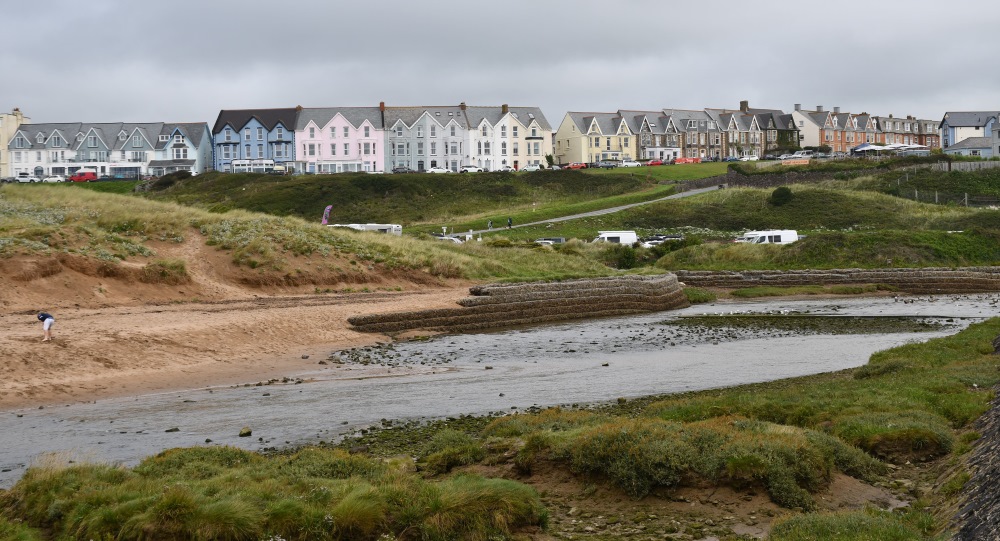
Image of Summerleaze beach and stepping stone across the River Neet in1893 (Courtesy of the Francis Frith collection) and in 2023.


Image of Summerleaze from the Bude harbour lockgates in1955 (Courtesy of the Francis Frith collection) and in 2023.
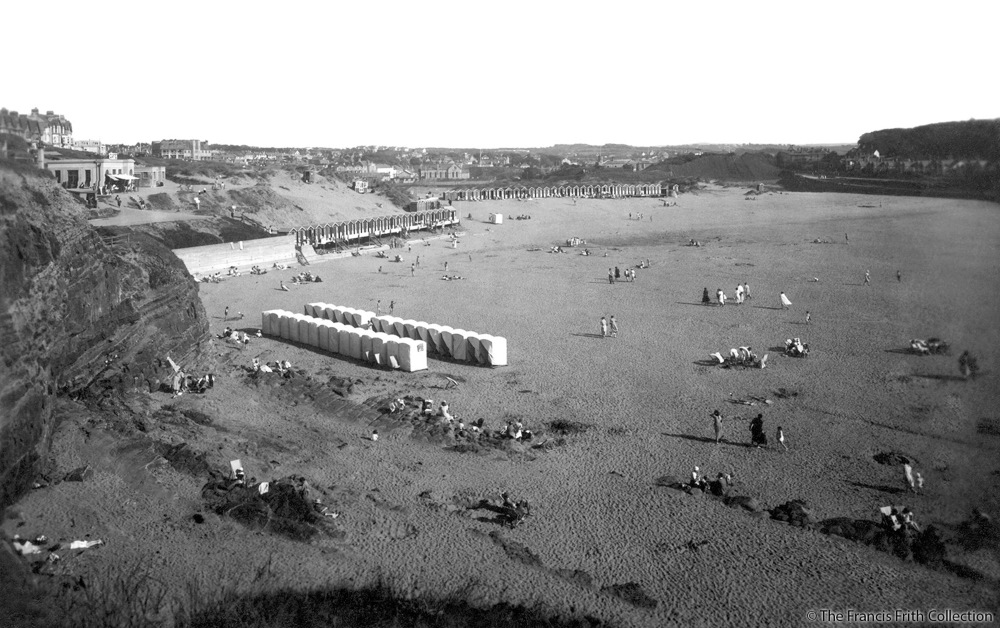

Image of Summerleaze beach and dunes from Summerleaze Downs in 1936 (Courtesy of the Francis Frith collection) and in 2023.
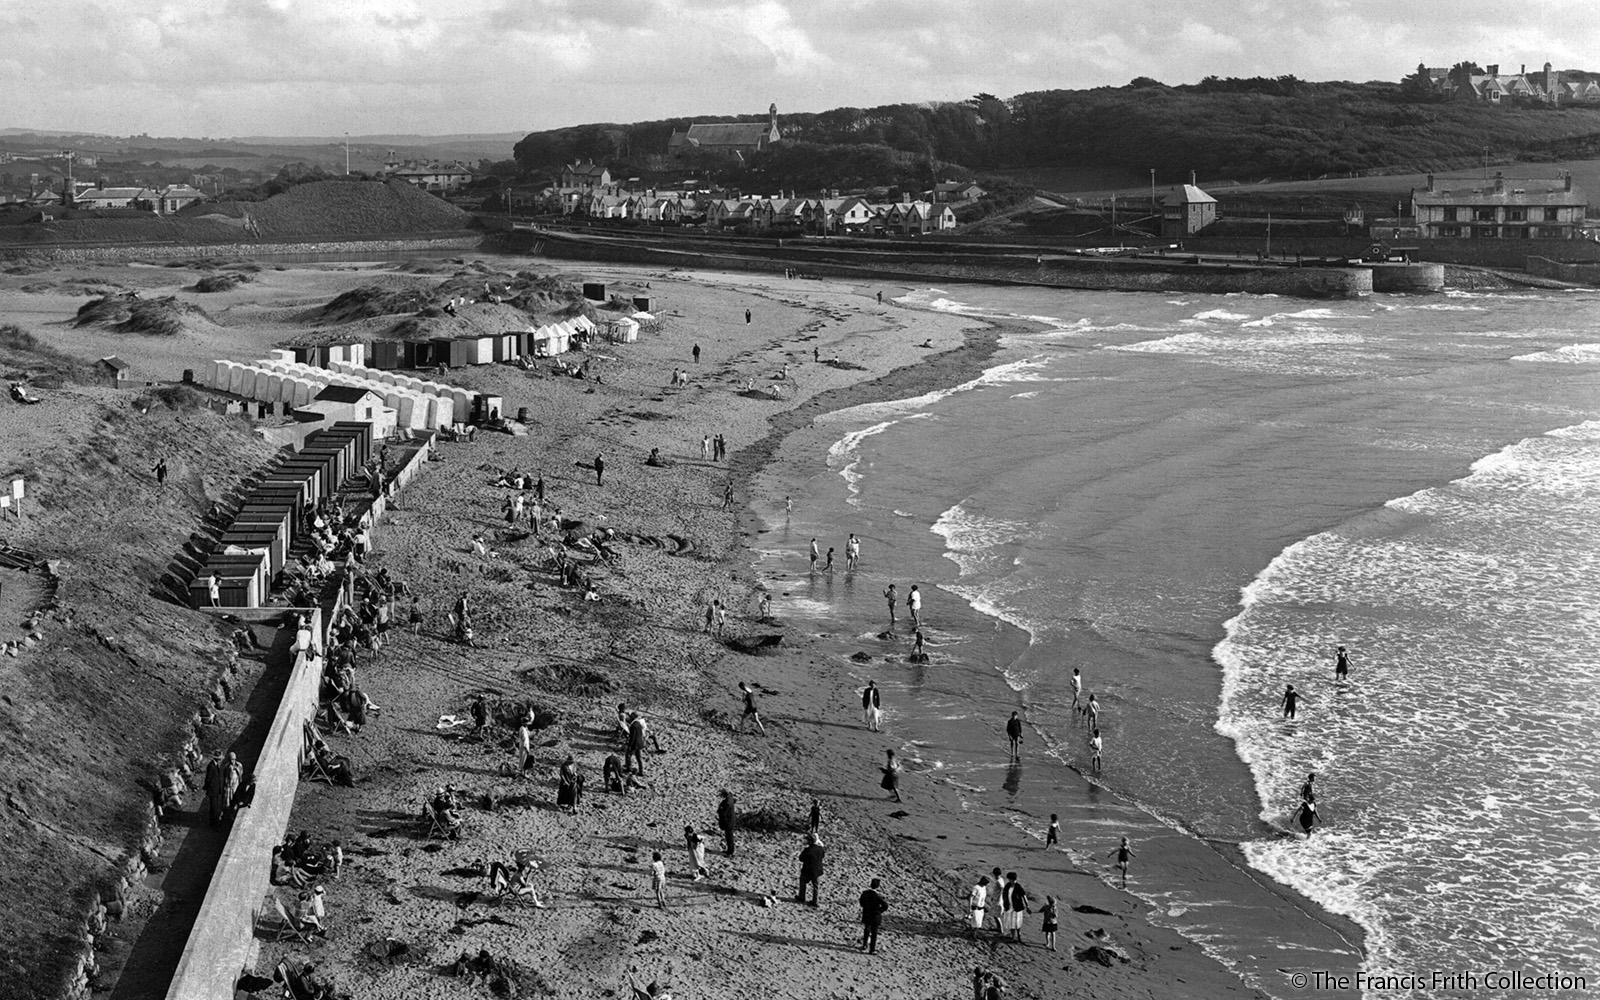
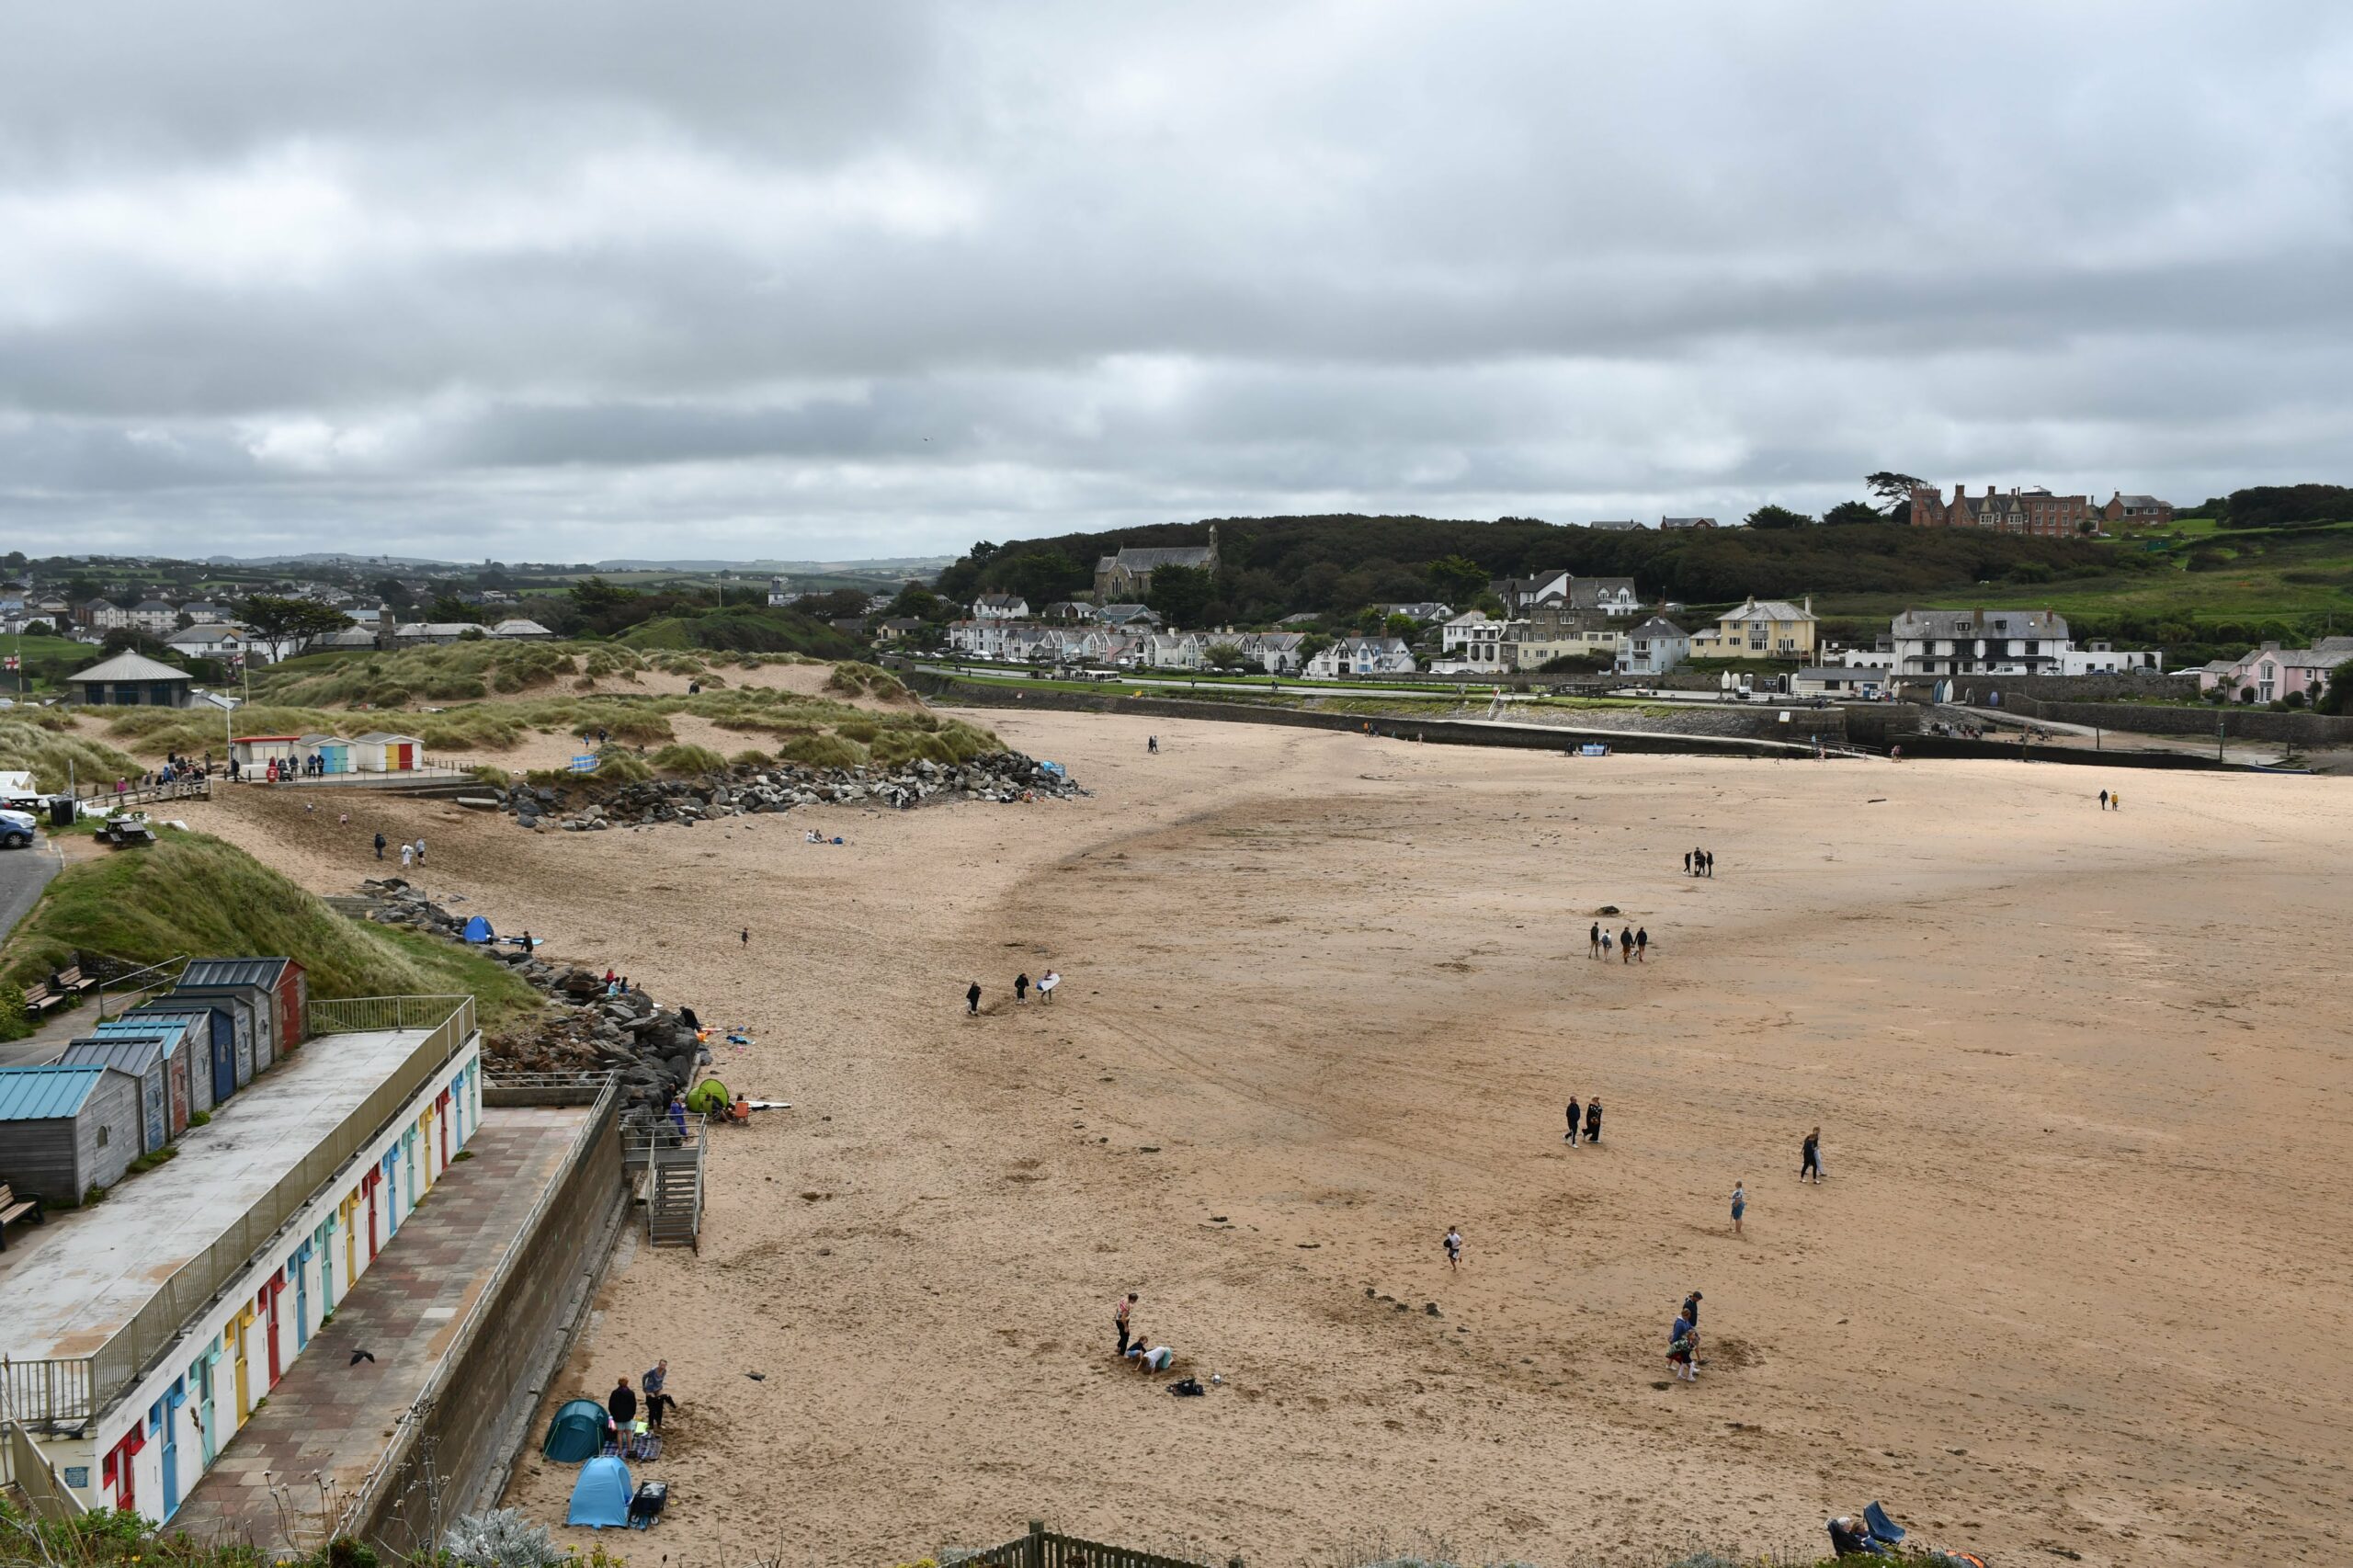
Image of Summerleaze beach and dunes from Mentone Cliffs in 1926 (Courtesy of the Francis Frith collection) and in 2023.
CoastSnap
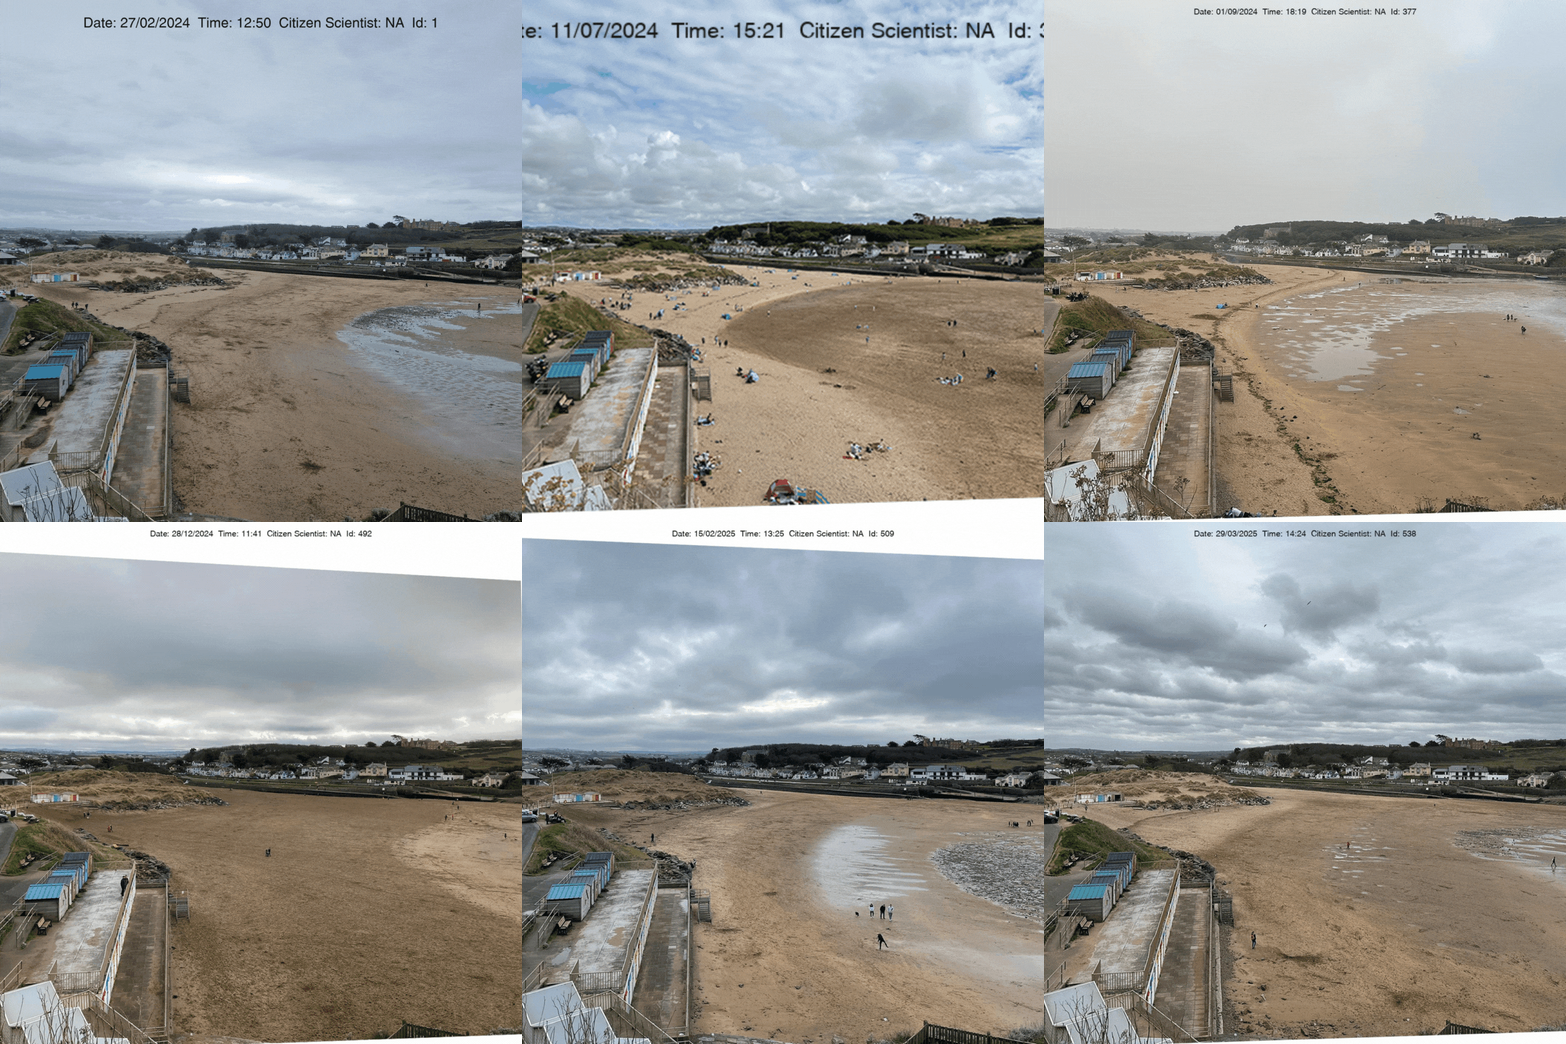
CoastSnap, is an innovative community science project, originally started in 2017 in Australia. It enables communities to take part in coastal science by capturing and sharing images of their local beaches using specially designed phone cradles. From these images, we can monitor coastal change, beach change and the impacts of climate change on the region’s coastlines.
On behalf of MS4S, project partner South West Coastal Monitoring have installed 23 CoastSnap stations at strategic locations around the coast including this location. We have collated some of the images taken at this location and overlaid them, so you are able to see the series of changes that have taken place over time in the animation below.
For more information on CoastSnap and how to participate please go to our CoastSnap page or visit: southwest.coastalmonitoring.org/coastsnap-home/

Modelling Coastal Change
Using data that has already been collected, combined with data collected through the Making Space for Sand project, a series of models will be carried out at each location. This will help us better understand how each location may respond to sea level rise and gain a deeper understanding of how coastal sediments move and behave.
The complexity of the modelling, and the data collection that helps inform it, means that modelling outputs will not be the same on all sites. Some locations will be more thoroughly investigated to understand more complex issues and provide data that can be more widely applied to other sites with similar characteristics.
As the project develops this section of the website will expand, sharing new reports and coastal change projections when they are produced.
Beach Report
The South West Coastal Monitoring (SWCM) programme have routinely been collecting data about the Cornish coastline since 2006. The aim of the data is to better understand changes observed on the coastline to help enable coastal managers to plan for future coastal change.
Using several years of information, SWCM have created a beach report for each MS4S site, including one for Summerleaze. The purpose of this report is to help the reader better understand the range of surveys completed on Summerleaze and see the changes recorded. Some of the changes observed are gradual, whilst others, such as those associated with serve storm conditions, are more sudden and dramatic.
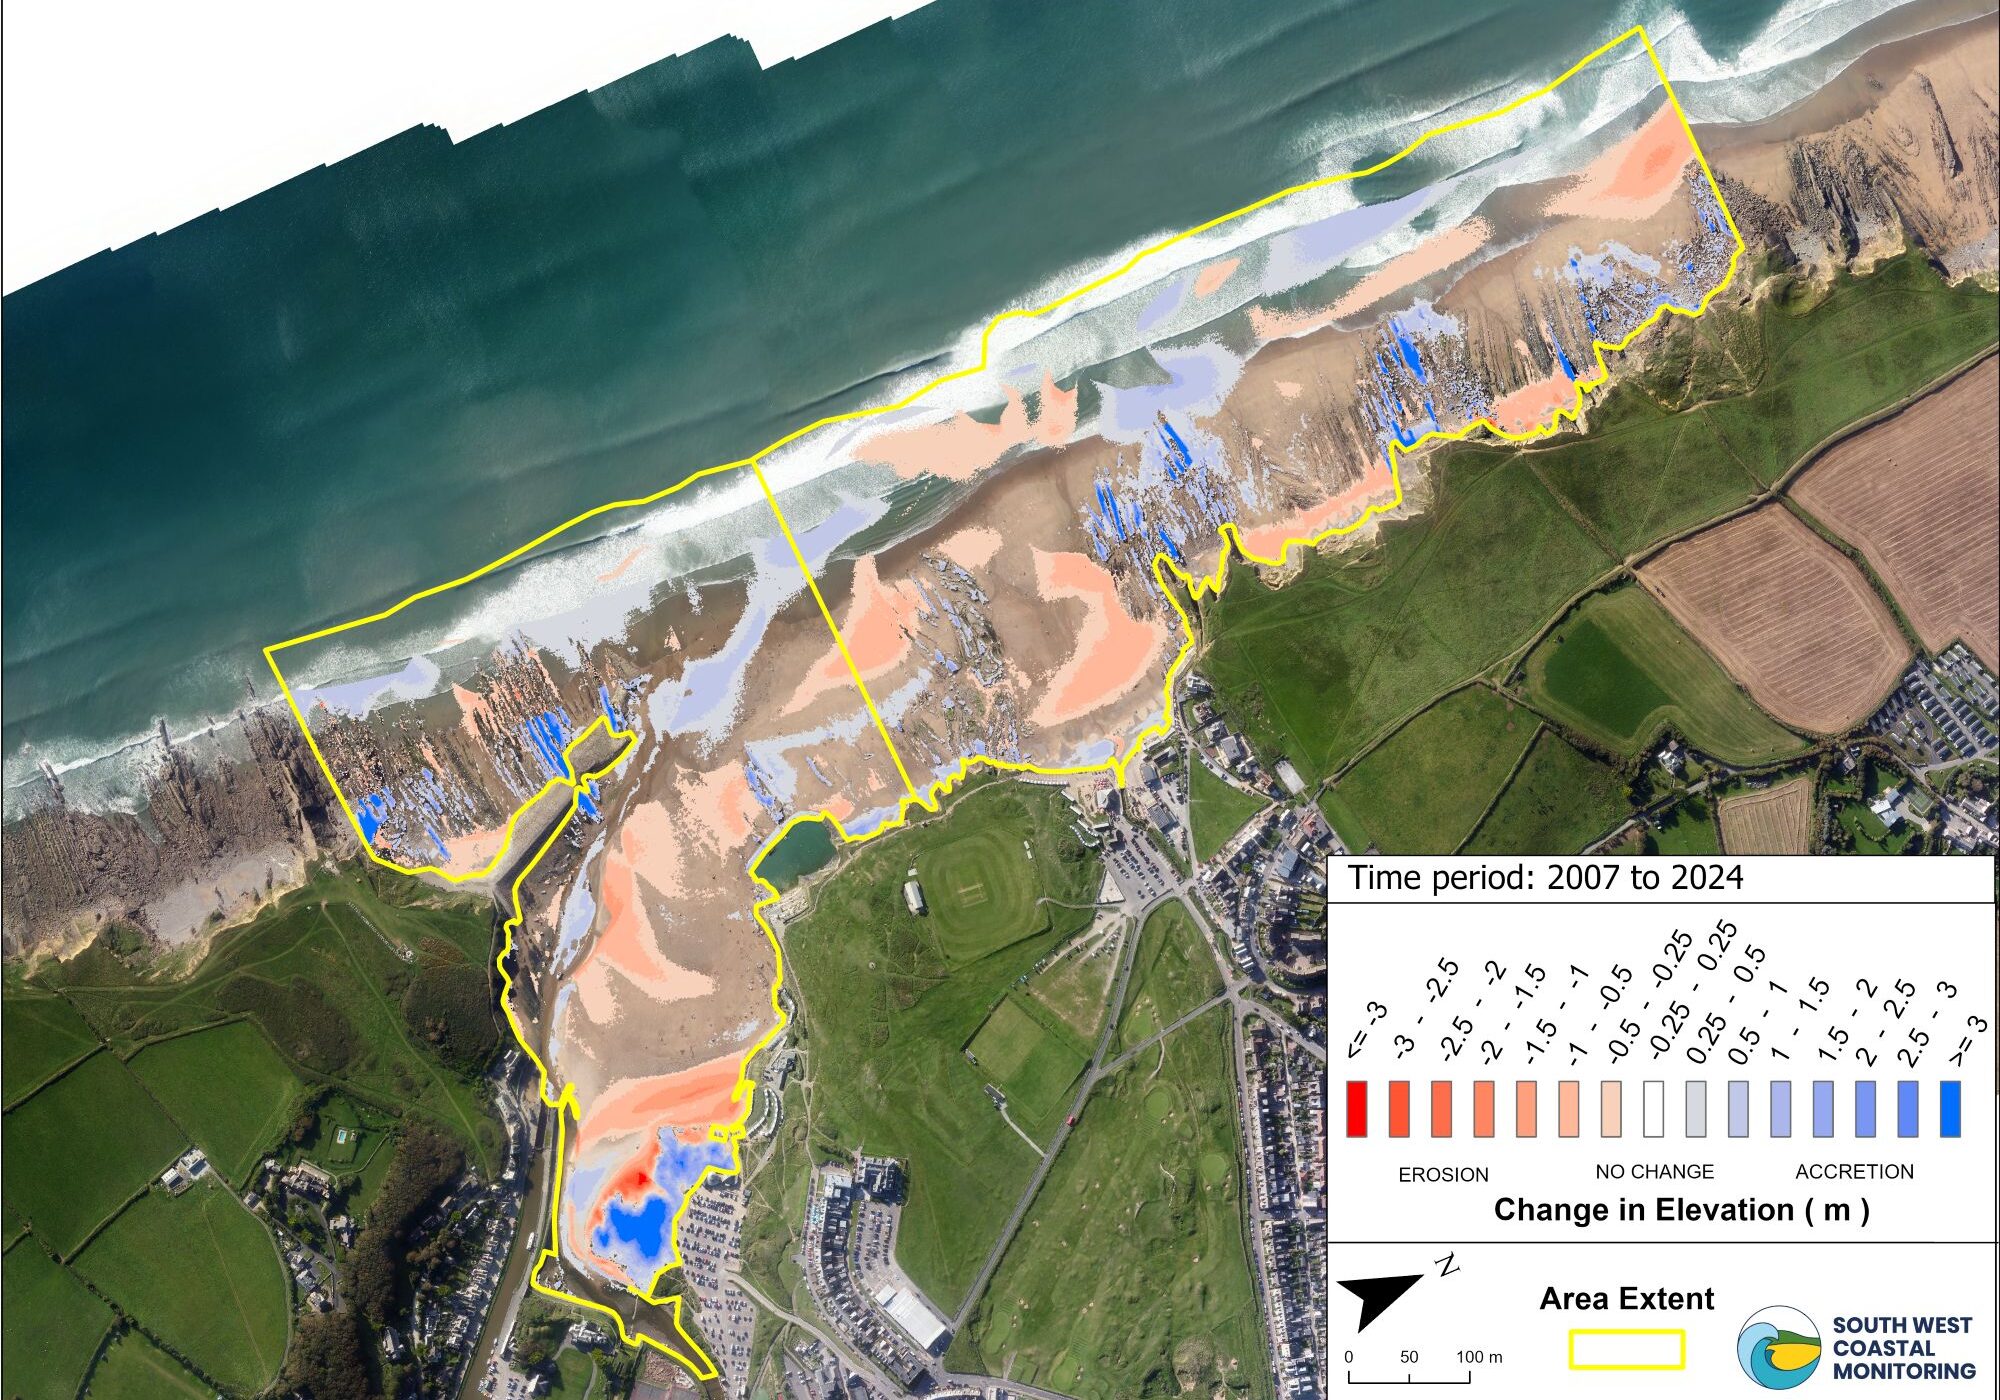
The picture above represents a combination of LiDAR data captured from c2008 - 2025 and the shading illustrates how sand (sediment) has been gained and lost over this period of time. The areas shaded blue are areas where sand has built up (increase in sediment) and areas shaded red show where sand has been lost (erosion of sediment). The deeper the shade of red or blue, the greater the level or erosion or accumulation.
SWCM provide an interactive map viewer on their website that allows users to explore and view the various data types they collect. If you want to learn more about this location, or other beaches in the south west, please visit their Map Viewer webpage.
Bruun Rule
Future change in the dune toe position, at this location, has been projected using either Bruun rule or estimated based on observed trends. The Bruun rule is a mathematical model to help us predict how our beaches will change with sea level rise. It is based on the theory that beaches will shift upwards and landwards in order to ‘keep up’ with sea level rise. The Bruun rule doesn’t consider all variables so there is a degree of uncertainty with these projections, however, they represent a first-stage assessment of future dune behaviour in Cornwall.
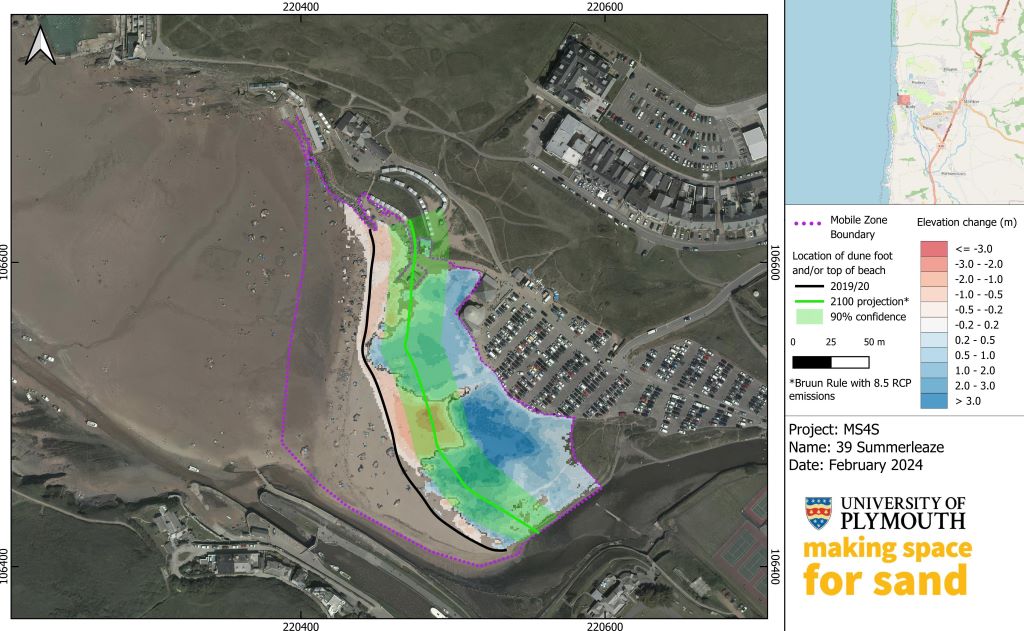
On Summerleaze beach sediment is eroding from the uppershore and/or dune toe and there is an increase in the volume of sediment in this area, which is potential evidence of coastal rollback. With sea level rise the estimated rate of retreat at the location is 27m (0.36m per year) by 2100. For more information please visit the Bruun Rule section on the Data Modelling webpage.
The visual presented above displays a number of things. The areas shaded blue are areas where surveys identify an increase in elevation (accumulation of sediment) and areas shaded red a decrease in elevation (erosion of sediment). The deeper the shade of red or blue, the greater the level or erosion or accumulation. The solid black line marks the edge of the dune toe and/or the top of the beach. The solid green line marks the projected rate of erosion by 2100, by using the Bruun Rule. This assumes the highest baseline climate change scenario where emissions continue to rise throughout the twenty-first century, Representative Concentration Pathway (RCP 8.5). The faint green line either side of the solid green line visualises the 90% confidence interval for the projection, indicating how the situation could be better or worse than projected.
Tromino
Tromino surveys help scientists find out how much sand is stored beneath a beach without digging. A small device called a Tromino measures tiny natural vibrations in the ground caused by waves, wind, and traffic. Different materials such as sand, gravel, clay, and rock vibrate in different ways, allowing scientists to estimate what lies below the surface and how deep it is.
The results are used to create underground maps of beaches, showing where sand layers end and rock layers begin. This helps scientists understand how beaches may change in the future as sea levels rise and storms become more frequent. The information is also used in computer models to support coastal management and help protect coastlines.
Please find below the report for this location:
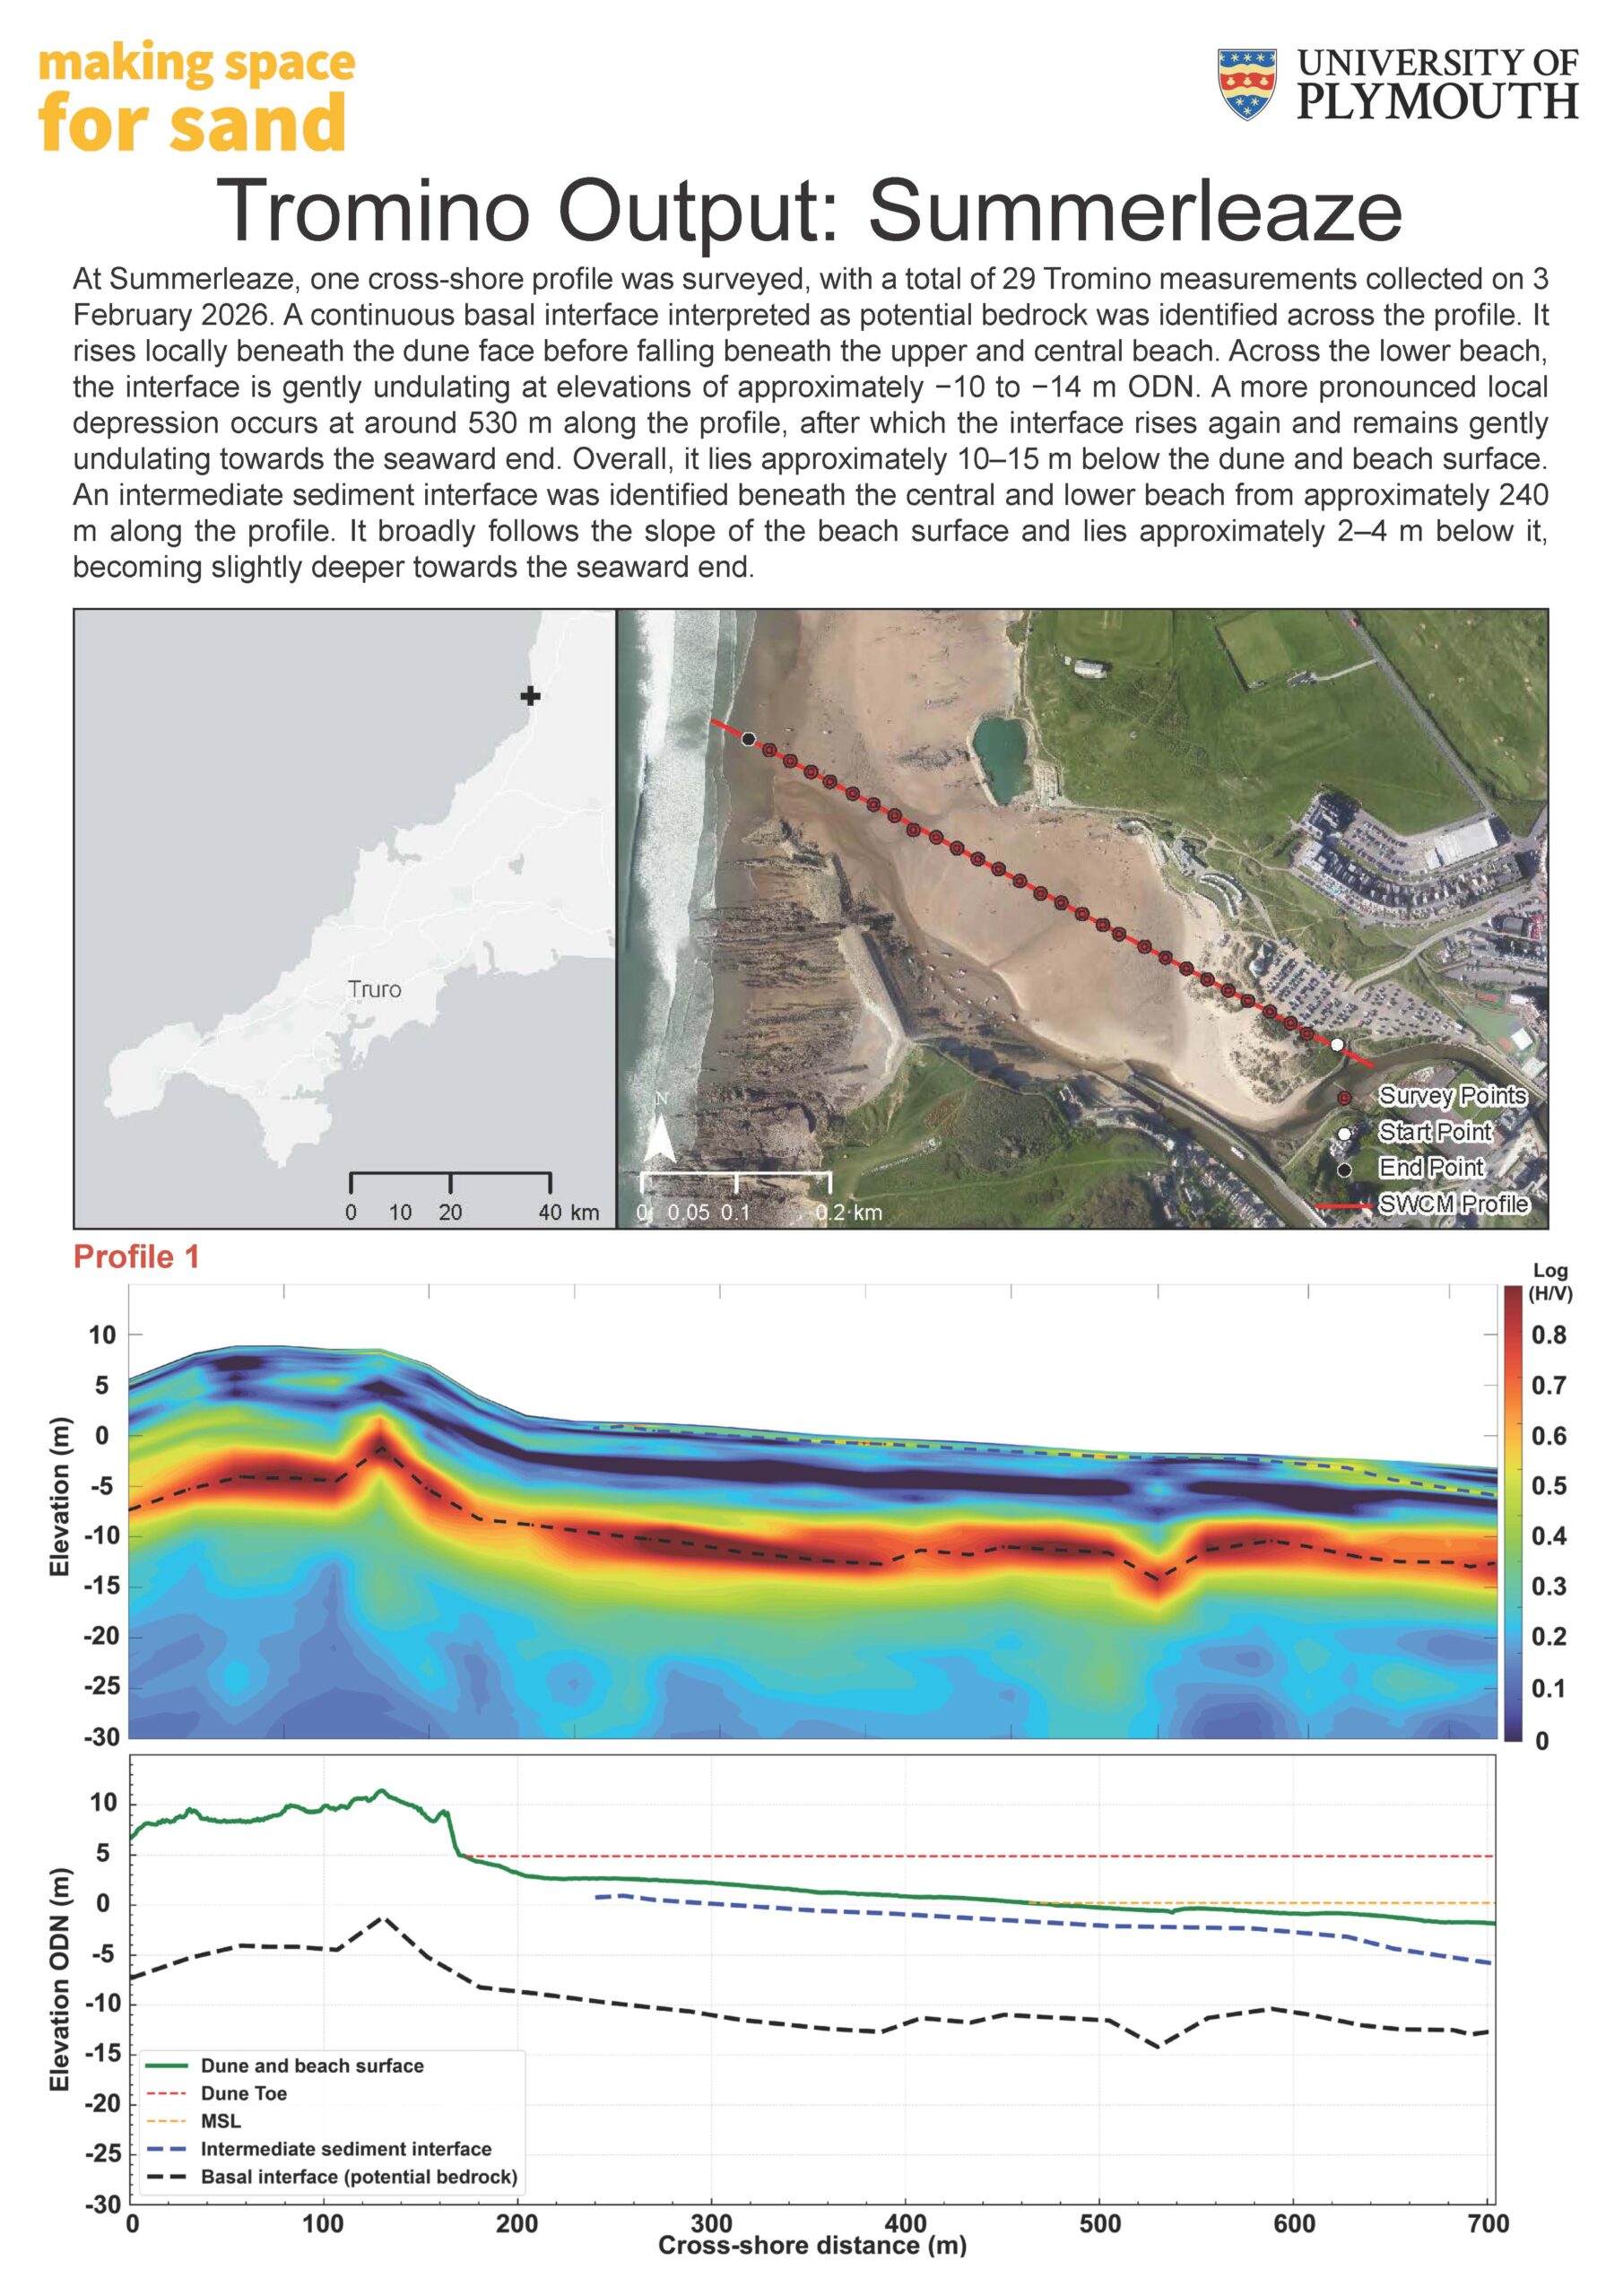
To interpret Tromino data, read the graph from left to right, moving from the dunes towards the lower beach. The green line shows the beach surface, while dashed lines represent boundaries between different underground materials, such as sand, gravel, or bedrock. The dashed yellow line represents the Mean Sea Level (MSL) which is the average height of the sea surface used to measure elevation.
Areas coloured red and yellow indicate stronger changes between layers and help identify where these boundaries are located. Blue and green colours show weaker changes. The deeper dashed black line usually represents the base of the sediment or possible bedrock, while dashed blue lines show shallower sediment layers. By looking at the depth and position of these layers, scientists can estimate sediment thickness across the beach.
South West Coastal Monitoring Dashboard
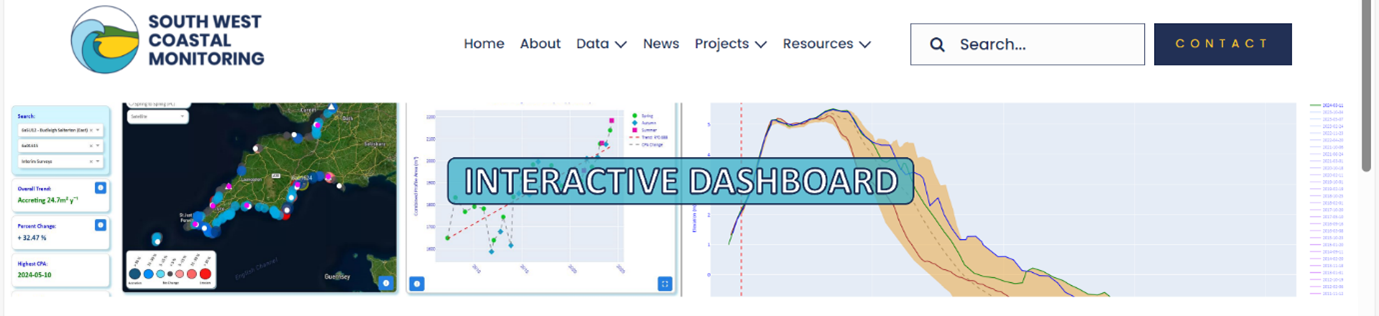
The South West Coastal Monitoring Dashboard is a new, interactive and intuitive tool which you can use to analyse the latest and historic topographic data for all beaches in the South West.
The Dashboard's main purpose is analyse how beaches across the South West have changed historically over the last 18 years. It provides an overview of change of the South West but also allows you to investigate in detail, certain beach profiles for a specific survey date at a site of interest. The Dashboard displays the following six interactive features:
- Map Overview - Provides a regional overview of historic and yearly change for each survey unit.
- Combined Profile Area Chart (CPA m²) - Represents the combined profile area trend in cross-sectional area (CSA m²) for each survey unit.
- Profile Cross-Sectional Area Chart - Provides a visual representation of the beach profile cross-sectional area (CSA m²) change.
- Box Plot - Displays the latest cross-sectional area (CSA m²) min, max, upper and lower quartile ranges for all profiles in the survey unit.
- Cross-Sectional Area Change Table - Displays cross-sectional area (CSA m²) and percentage change values for each beach profile.
- Survey Report Generator - Automatically generates a topographic survey report for a survey unit of choice.
To access the South West Coastal Monitoring Dashboard please click on the button below:

Beach and Dune Ecology
Beaches and dunes represent an important transition between the marine environment and the terrestrial environment. This transition creates a range of special habitats and exposes interesting features, which that can result in these spaces being highly designated and protected.
At Summerleaze a dune habitat survey has been completed to help better understand the condition of the dune system. The survey identifies challenges that impact on the quality of the dune system as well highlighting rare and interesting finds made on it. In some instances the surveys also consider data collected from habitat surveys carried out in 2005. Where this has been possible it enables us to understand how the dunes have changed over a relatively short period of time.
Across the site 2.6ha of vegetated habitat was mapped. The range of different habitats mapped on Summerleaze included; shifting dunes with marram grass (42%), dune grassland (41%), mixed scrub (9%), Bramble scrub (7%).
The dunes at Summerleaze have a diverse range of plants associated with it. A range of ecologically interesting and notable plants have previously been recorded on the site. During the survey sea holly, sea bindweed, sea spurge, horn plantain and wild leek were observed, all of which are nationally rare.
Though the bramble and scrub provide shelter and foraging, it can negatively impact on biodiversity. A range of invasive plants, such as Japanesse Rose, hottentot fig and montbretia have become well established within these bramble scrub areas and risk spreading along with the bramble and scrub. The dune also suffers from high footfall. Though this enables to dunes to be more mobile, in places footfall is making conditions for plants to establish. In some area the dune is also suffering from nutrient loading from dog fouling.
Image shows Sea Holly

Comparison with 2006
A Habitat Assessment of the site was undertaken in 2006. When comparing this to the 2023 survey, it can be seen that bramble scrub has become significantly more dominant on the site. Though areas of the dune remain unvegetated there has been a slight increase in the areas that are now vegetated. The areas of bare sand have shifted and changed, which is not unusual in a dune system.

From a Biodiversity Net Gain perspective, key opportunities for enhancement at Summerleaze are the removal of invasive plant species. There is also a need to control scrub within the dune. Although it’s part of the successional process of dunes, it should be implemented in order to prevent overstabilisation and preserve and enhance a patchwork of habitats. The dune is also under pressure from human disturbance. Some more sensitive areas of the dune would benefit from having more limited footfall. This could be achieved if small areas were fenced off.
Image shows Japanese Rose which is a non-native species

Designations
Site of Special Scientific Interest (SSSI)
A Site of Special Scientific Interest or SSSI is a statutory conservation designation notified by Natural England denoting protection for biological and/or geological characteristics. The natural wildlife and geological features of SSSI’s are considered to be irreplaceable parts of the national heritage. These are protected in order to preserve their importance, and to prevent damage and development.
The Bude Coast SSSI covers an area of 92.5 hectares and considers the cliffs between Compass Cove and Furzey Cove, immediately adjacent to Bude. The stretch of coastline exhibits important geological features, and the coastal cliff-top grassland to the south of Bude Haven support a number of rare and locally restricted plants.
Image of the zig-zag chevron folding on the cliffs of Millook Haven (Courtesy of Coralie Barrow)
Marine Conservation Zone (MCZ)
A Marine Conservation Zone (MCZ) is a type of marine protected area, designated in English, Welsh and Northern Ireland territorial offshore waters, to protect a range of nationally important, rare or threatened marine habitats or species by halting or reversing damage and degradation caused by human activities.
The Hartland to Tintagel MCZ covers an area of 304km² following the coastline along, along Mean High Water (MHW) from Hartland Point to Tintagel Head. The MCZ contains deeper water and intertidal rocky and sandy habitats home to a diversity marine creatures, such as the sponges, honeycomb worms and pink sea-fans.
Image of a velvet swimming crab (Courtesy of Tony Sutton)

Beach Dune Management Plan
Many of the sand dunes and beaches around Cornwall’s coast are experiencing net erosion and sediment loss. This is due, in part, to lack of new sediment input to the shoreline system and rising sea levels. This is a pressing concern as these environments provide protection against the risk of coastal flooding, provide important habitats that cannot be easily recreated elsewhere if lost and help support the regions thriving tourism industry. It is therefore vital that the sand dunes and beaches around Cornwall’s coast are managed in a more sustainable way that balances the combined functions of beach-dune system.
In 2015, Cornwall Council produced Beach Dune Management Plans (BDMP’s) for 10 locations in Cornwall, including one at this location. The aim of the BDMP’s was to:
- Identify the best day-to-day management approach in terms of monitoring and intervention for the beach and dune system.
- Provide a longer-term approach to beach and dune management based upon an up-to-date understanding of coastal processes at the site, as well as predictions of future coastal evolution.
Where possible the Making Space for Sand project will use these BDMP’s, supported by the data it collects, to work with landowners and environmental groups to help build more resilient and more biodiverse beaches and dunes that will help protect people and place from coastal erosion.
Sign up to Making Space for Sand
If you would like to get involved in helping to make dunes more resilient and biodiverse, want to help develop coastal adaptation and emergency plans or just want to know more about what the project is learning about coastal change, please click here: